
Why Your Company Needs a SaaS Health Dashboard
If you are a finance or IT leader at a growing company, you already know the feeling: SaaS subscriptions multiply faster than headcount, renewals slip through the cracks, and the CEO asks for a software spend summary you cannot produce without a week of spreadsheet archaeology.
The problem is not a lack of data but rather a lack of structure. Most companies track SaaS spend reactively, pulling numbers only when requested. A SaaS health dashboard changes that by turning scattered subscription data into a single, real-time view of your software portfolio's financial and operational health.
Why Software Spend Optimization Matters Now
According to recent industry data, SaaS spend per employee has risen to $5,607 per year, a 7% increase year-over-year. At the same time, organizations waste between 25% and 35% of their SaaS budgets on unused or underutilized licenses.
For a 200-person company spending $1.1 million annually on software, that translates to $275,000 to $385,000 in pure waste—enough to fund two or three strategic new hires.
A well-built SaaS management KPIs dashboard solves three problems at once:
- For Executives: It gives the CEO and board a clear, defensible view of software spend without manual data gathering.
- For IT Leaders: It provides instant visibility into ungoverned, redundant, or shadow IT applications.
- For Finance Teams: It delivers the variance data needed to forecast accurately and negotiate renewals from a position of strength.
To help you build a comprehensive view of your software ecosystem, we have organized the top 12 SaaS management KPIs into four essential categories: Spend, Utilization, Risk, and Efficiency.
The 12 SaaS Management KPIs Every Dashboard Should Track
💰 Spend KPIs
Spend KPIs answer the core questions your CFO and board will ask: How much are we spending on software, and is it under control?
1. Total SaaS Spend
The sum of all software subscription costs across the organization in a given period (monthly or annually). This is your top-line metric and the anchor for your dashboard.
- What to include: Both centralized subscriptions paid through procurement and decentralized purchases made on team credit cards or expense reports.
- The Reality: The typical company with 30 to 500 employees has roughly 57 known SaaS subscriptions—but that number jumps significantly once shadow IT is factored in.
- Formula:
Sum of all SaaS subscription payments in the period - Benchmark: For scaling tech companies, expect $4,000 to $7,000 per employee per year, depending on region and growth stage.
2. SaaS Spend Per Employee
Total SaaS spend divided by full-time employee (FTE) headcount. This normalizes your spending against company size and is the single best metric for benchmarking against industry peers.
- Formula:
Total SaaS Spend / FTE Count - Benchmark: The current industry average is $5,607 per employee per year. Companies that actively manage their SaaS portfolio typically run 20% to 30% below this figure.
3. Month-over-Month (MoM) Spend Growth
The percentage change in total SaaS spend from one month to the next. This serves as your early warning system. While a steady climb is expected as you scale, sudden spikes signal ungoverned purchases or unreviewed auto-renewals.
- Formula:
((Current Month Spend - Previous Month Spend) / Previous Month Spend) x 100 - Benchmark: Healthy MoM growth should closely track headcount growth. If software spend grows at 2x or 3x the rate of hiring, you have a governance problem.
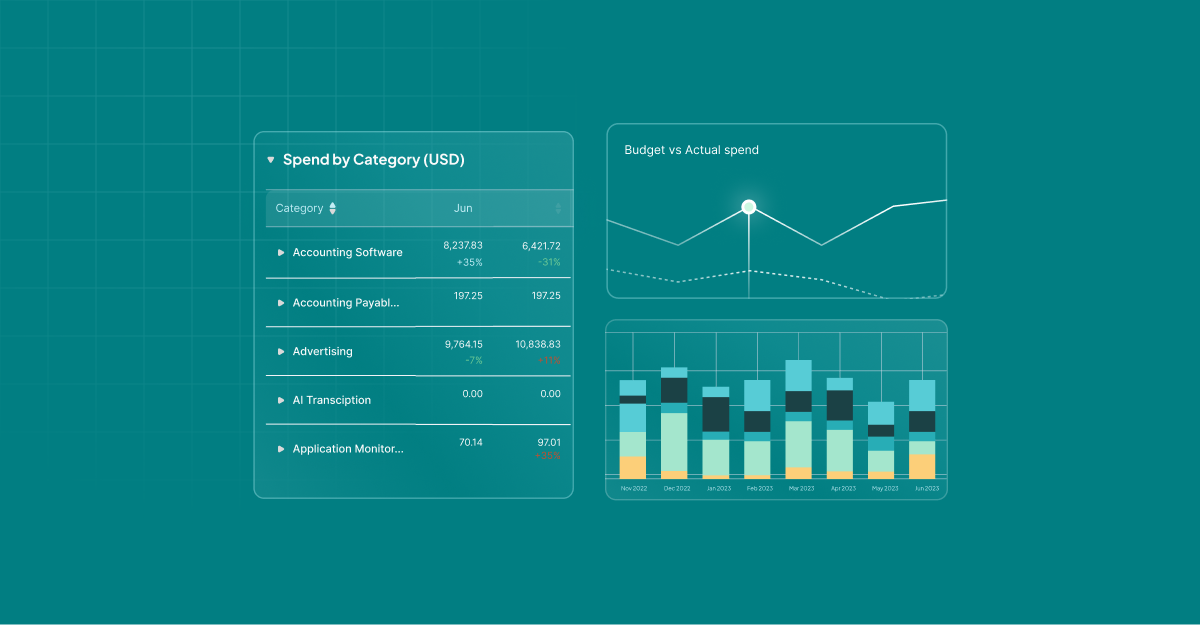
4. Budget Variance
The difference between planned (budgeted) SaaS spend and actual spend, expressed as a percentage. This is the metric your CFO cares about most when reporting to the board.
- Formula:
((Actual Spend - Budgeted Spend) / Budgeted Spend) x 100 - Benchmark: Best-in-class organizations keep variance within +/- 5%. With median SaaS prices increasing 7.8% year-over-year and 73% of vendors charging separately for AI features, tight variance control requires real-time tracking.
📊 Utilization KPIs
Spend data tells you what you are paying for; utilization data tells you what your team is actually using. The gap between these two numbers is where your biggest cost savings live.
5. Adoption Rate
The percentage of employees who have actively used a given SaaS tool within a defined period (typically 30 or 90 days). Low adoption on a company-wide tool means you are either overpaying for licenses or the software is failing to meet employee needs.
- Formula:
(Active Users in Period / Total Provisioned Users) x 100 - Benchmark: Core productivity tools (Slack, Google Workspace, Microsoft 365) should sit above 90%. Specialized tools (design software, data platforms) may legitimately run at 30% to 50%. Anything below 20% warrants immediate investigation.
6. License Utilization Rate
The percentage of purchased licenses that are actively used. While adoption rate focuses on provisioned access, this KPI focuses strictly on paid seats. A tool might have high adoption among its designated users, yet still have 40% of its paid licenses sitting idle.
- Formula:
(Active Licenses / Total Purchased Licenses) x 100 - Benchmark: Industry-wide, license utilization sits at a mere 49% to 54%, meaning nearly half of all purchased SaaS licenses go unused. Top-performing organizations push utilization above 80% through quarterly reviews.
7. Active vs. Provisioned Users
A direct, tool-by-tool comparison showing how many users have been granted access versus how many actually log in. This creates a visual gap analysis that makes software waste immediately obvious to non-technical stakeholders.
- Visual Format: Best displayed as a paired bar chart or comparison table.
- Benchmark: The average employee uses 11 to 13 applications daily. If your organization has provisioned 30+ tools per employee but only 12 see regular use, the delta represents both cost waste and an unnecessary security surface area.
⚠️ Risk KPIs
Risk KPIs protect your organization from compliance failures, security gaps, and financial surprises. These metrics are critical for IT governance and modern security audits.
8. Ungoverned Applications (Shadow IT)
The number of SaaS tools in use across the organization that were not procured through official channels.
- The Risk: Research shows that 80% of employees use SaaS applications without IT approval. Furthermore, with 98% of organizations reporting unsanctioned AI tool usage, tracking shadow IT is critical for data governance.
- Formula:
Total Discovered Apps - Total Approved Apps - Benchmark: The typical scaling company discovers 20+ unknown applications when they first deploy dedicated discovery tools.
9. Expiring Contracts (Next 90 Days)
A rolling count of SaaS contracts approaching their renewal or cancellation deadline within the next 90 days. Missing a renewal window means losing your negotiation leverage entirely and absorbing automated price hikes.
- Formula:
Count of contracts with renewal dates within T+90 days - Benchmark: Because 69% of software contracts include auto-renew clauses with 30-to-90-day cancellation windows, best practice is to flag contracts 90 days out to review utilization data before deciding to renew, renegotiate, or cancel.
10. Compliance Gaps
The number of active SaaS vendors that lack required security certifications (SOC 2, ISO 27001, GDPR) or have skipped your organization's formal vendor risk assessment.
- Formula:
Count of active vendors missing required certifications or assessments - Benchmark: Currently, 55% of organizations lack a centralized inventory of all IT assets. Every ungoverned app is a potential compliance violation waiting to happen.
⚡ Efficiency KPIs
Efficiency KPIs connect spending directly to operational outcomes. They answer a fundamental question: Are we getting maximum value from our software investments?
11. Cost Per Active User
The actual cost of a SaaS tool divided by the number of people who genuinely use it—not just those who have access. This reveals the true unit economics of each subscription.
- Formula:
Annual Tool Cost / Number of Active Users - Example: If you pay for 100 seats at $15/user/month, but only 40 people use the tool, your effective cost per active user is actually $37.50, not $15.
12. Redundancy Percentage
The proportion of your SaaS portfolio where two or more tools serve overlapping functions. Common redundancies include multiple project management tools (Asana, Monday, Trello) or video conferencing platforms (Zoom, Teams, Google Meet).
- Formula:
(Number of Redundant Tool Pairs / Total Active Tools) x 100 - Benchmark: Most organizations carry 10% to 20% functional redundancy in their SaaS stack. Consolidating these overlapping tools yields instant budget savings.
Streamline Your SaaS Governance with Cledara
Building a custom SaaS health dashboard from scratch requires manually integrating billing data, HR systems, usage analytics, and contract records. It takes weeks of development time and demands constant upkeep.
Cledara eliminates this administrative burden by sitting at the intersection of all four data streams:
- Automated Spend Tracking: Every SaaS subscription paid through Cledara's virtual cards generates real-time financial data with automatic categorization by tool and department.
- Real-Time Usage Insights: The Cledara Engage browser extension captures actual software usage across the organization, powering accurate adoption and utilization metrics without manual employee surveys.
- Proactive Risk Management: Automated shadow IT discovery identifies ungoverned apps instantly, while renewal alerts flag expiring contracts 90 days out.
- Smart Efficiency Benchmarks: The Cledara Benchmarks module compares your software pricing against market rates (25th and 75th percentiles) so you know exactly where you are overpaying before a renewal conversation even begins.
For companies building their first software health report, Cledara provides the data layer and the presentation dashboard in a single platform—taking you from zero visibility to board-ready reporting in days, not months.
Ready to see these KPIs live in a dashboard tailored to your business?
Book a Cledara demo today and see your SaaS portfolio health score in minutes.


