Cledara can reveal that overall spending on software by companies has increased by 25% over the past 12 months.
This is based on Cledara’s data analyzing 234,000+ SaaS transactions in the ever-evolving world of software as a service (SaaS). Understanding these spending patterns across different company sizes can provide invaluable insights.
As Gartner predicts spending on software to top $1 trillion next year, Cledara's data sheds light on this software spending. How does software spend change month to month? Are there trends within each quartile? And what can these spending patterns tell us about the current SaaS market? Let's delve into the data to uncover these answers.


Key Takeaways**
The data presented provides a month-by-month breakdown of the percentage changes in software spending across four quartiles of companies, categorized by their level of software spending, from June 2022 to June 2023.
Top Quartile Companies, with a software spend of $190k to $825k, saw an overall decrease in software spending, with the most substantial dip in February 2023 at -4.0%. Despite this, they saw a significant increase in January 2023 with a 8.0% rise.
2nd Quartile Companies, with a spend of $108k to $189k, experienced the most significant increase in August 2022 with a 12.9% rise. However, they also saw a significant decrease in May 2023 with a drop of 7.4%.
3rd Quartile Companies, with a spend between $41k and $108k, had a rather unstable year. They experienced the highest growth in August 2022 with 8.8% and the lowest in June 2023 with a decline of 4.7%.
Bottom Quartile Companies, spending between $1k and $40k, also saw high variability throughout the year. They saw the most significant increase in August 2022 with a 10.0% rise but also experienced the steepest fall of any group in December 2022 with a decrease of 11.1%.
Across all companies, software spending peaked in August 2022 with a 7.4% increase but dipped the most in December 2022 with a -2.9% decrease. The fluctuations in software spending across the quartiles indicate a highly dynamic market over the period.
This growth signifies the enduring relevance and value of SaaS in the ever-evolving business landscape, as companies continue to invest in cutting-edge technologies to foster innovation, enhance operational efficiencies, and drive growth.
However, amidst the price hikes and economic challenges, businesses are being more judicious with their SaaS purchases, opting for comprehensive suites overspecialized tools, and favoring products that have proven to be mission-critical. As we move forward, these trends hint at a significant shift in SaaS buying behaviors, marked by a more conservative, value-oriented approach to software procurement.
SVB & High Interest Rates**
The recent failure of Silicon Valley Bank (SVB), a major tech industry lender, has had profound implications on the financial markets and tech industry, including on software spending patterns.
SVB's collapse obstructed many SaaS businesses' access to funding, exacerbating the already challenging financial environment. This has potentially prompted SaaS companies to increase their prices to counterbalance the financial blow meaning SaaS customers are paying more.
The impact on the broader financial market, coupled with the ensuing instability, have lead businesses to be more prudent in their SaaS purchasing decisions.
The Rise of Finance Teams**
Amidst this, our data indicates a shift in software spend across different team categories over the last year. The most significant increase in software spend is in the Finance department, with a Year on Year (YoY) change of 105%. This surge suggests a major investment in financial software tools, driven by a need for improved financial analytics, forecasting, and management.
The rise of finance teams in 2023 encapsulates the shifting dynamics in today's volatile market. CFOs are not only steering the financial helm but also playing a central role in optimizing operations, managing resources, and driving strategic decisions.

CFOs are increasingly being promoted to CEOs and this heightened responsibility means finance teams are directly influencing efficiency, productivity, and the bottom line, essentially transforming them into strategic pillars for sustainable growth and resilience in the face of economic uncertainty.
Customer Support follows closely behind with an increase of 79%, signaling a robust dedication towards enhancing customer relations and satisfaction - possibly via customer relationship management (CRM) systems or customer engagement platforms.
Data and Engineering departments saw a significant increase in software spend, with a respective 45% and 44% increase. These increases reflect a commitment to improving data-driven decision making and engineering workflow efficiency.
With a 41% growth, Customer Success teams have shown a substantial dedication towards customer retention and satisfaction, possibly utilizing tools to analyze customer behavior and engagement.
Other departments have also boosted their software spend by 38%, while Sales departments experienced a 33% increase, highlighting an overall effort to enhance operational efficiency and customer interactions.
In contrast, the Product and Operations departments witnessed a downturn in software expenditure, with a decline of 11% and 24% respectively. This could be due to cost-saving measures, the optimization of existing tools, or discontinuation of underperforming software.
Company-wide software expenditure saw a moderate growth of 12%, indicating a slight shift towards department-specific tools over universal ones.
With marginal growths, IT and HR have experienced a 14% and 13% increase, respectively, possibly due to streamlining of existing tools, cost-saving measures, or the termination of underutilized software. The Marketing department also saw a moderate increase in software spend by 12%, underscoring a commitment to bolstering brand exposure and customer interactions.
Design department expenditure grew by 17%, showcasing an interest in improving creative outputs and user experiences.
The Legal department's software spend only grew by 1%, suggesting a focus on cost-effective legal software solutions or the conclusion of expensive, one-off legal software engagements.
These changes represent a strategic realignment of software expenditure, with companies focusing resources on key areas that drive growth and efficiency, while economizing in areas where they can find more cost-effective solutions or improve current processes.
Top 10 New Software Applications for Q2 2023**
Cledara continues to see our customers adopting new tools in high-value areas. Here are 10 new SaaS applications that Cledara customers used for the first time in Q2:
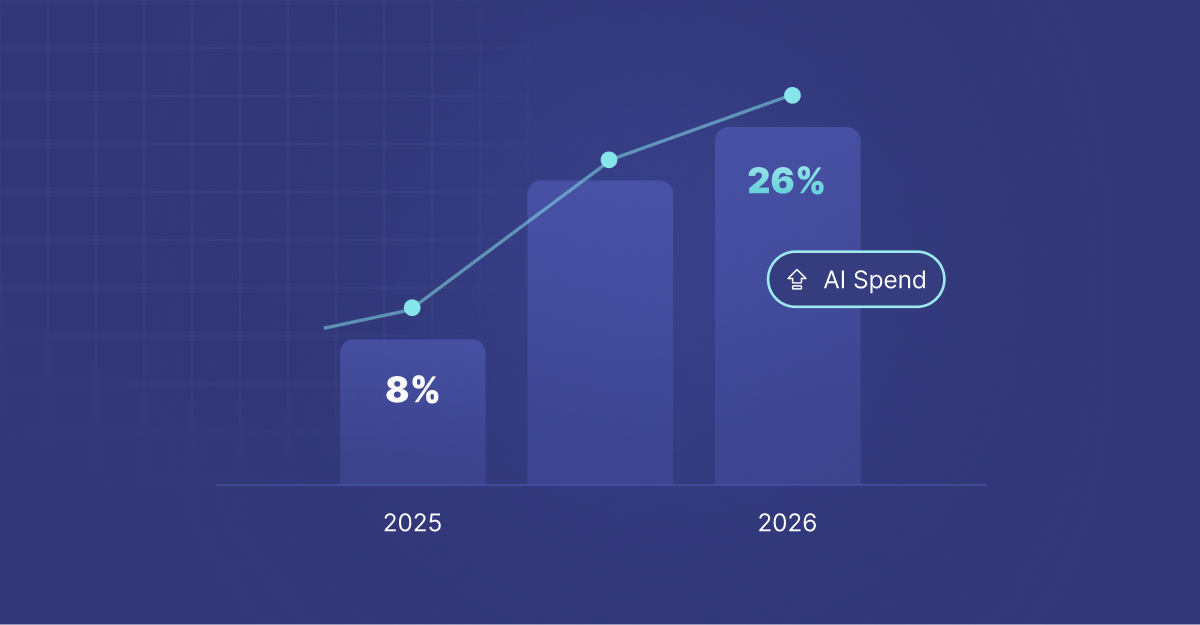
Only two of the top ten new tools in Q2 are AI tools, down from four out of the top ten in Q1.
Richard Gargan, analyst for Cledara, said:
“It's clear that current market conditions are necessitating strategic changes in software spend, most noticeably towards value-centric and mission-critical tools. SaaS providers should carefully construct their go-to-market strategies, placing emphasis on demonstrating value, utility, and ROI in their offerings.”
Up Next**
Cledara continues to monitor software spend trends each month. Stay tuned for our next report on software spend for Q3 2023. Subscribe to our newsletter to be notified when we release this report.
Thinking about your software stack? Learn more about Cledara’s SaaS management platform, the one platform to manage all your software subscriptions that helps companies reduce software costs by up to 30% and save up to 20 hours a month on finance & software administration.
Methodology**
For software spend analysis, Cledara looked at a sample of over 1000 companies, representing 40,000+ SaaS transactions.