November 4, 2020
3
MIN READ

How Can I Reduce My SaaS Spend Today?

Finance

Spend 30 seconds to see how much you can reduce your SaaS spend by switching to Cledara

According to recent research, it’s expected that by 2025, 85% of businesses will be SaaS-based. Which means that SaaS spend will become a bigger expense every year. This has many implications, but we want to focus on a very particular one, affecting finance teams all around the globe.

If you are into finance, you need to worry about this. Because software has changed and the way it is traditionally managed needs to change too. Software is no longer purchased in licenses but rather on subscriptions, literally software-as-a-service. And this brings massive challenges. From security to procurement to expenses. In this post we will focus on the expenses.

If you still use spreadsheets to manage your software, don’t worry, you are in the right place. And you are about to discover a whole new world. And if you already knew about software asset management tools, you are in the right place too.

Good news is: you can save a lot of money on SaaS with smart SaaS management!

Actually, we have built an online calculator which will let you know exactly how much your company can save by using a SaaS spend management tool.

And how is that number calculated?

Easy, just fill in the numbers and our math will do the work!

And how can a tool like Cledara save my company on software?

That is a good question. Because this is due to a combination that you will not find elsewhere. Our customers can reduce their software spend thanks to two splendid features. The first is our unique rewards program, which will earn you cash back for every software transaction you make in the platform. And the second reason is our FX fees policy, which is better than any bank.

If you want to know exactly how much you can save check it out NOW!

Suggestions and subscribe!

This post was inspired by questions provided by people like you. We love receiving new and interesting questions that help us think about data in new ways.  If you found this post interesting and have other questions that you’d like us to help answer about software spend management, drop us a line at hello@cledara.com.

Scroll down to subscribe to our blog!


Contents

Contents

The software management solution for finance teams.

Learn more

Subscribe to our newsletter

Receive the latest insights in your inbox

Share this post

Subscribe to our newsletter and stay informed on the latest SaaS insights

Sign up

Explore more

Hero banner for 10 things to build with the Cledara API: data squares assembling into a chart tower, calendar, and robot on deep teal

10 Things You Can Build with the Cledara API

Ten practical builds for the new Cledara API, from live spend dashboards and accounting feeds to renewal calendars, budget alerts, and AI agents.
Read more
The Cledara API hero banner: subscription data flowing from a payment card tile through pipes into calendar, chart, and invoice tiles

Introducing the Cledara API: Your Software Subscription Data, Wherever You Work

Your software subscription data, available programmatically. What the new Cledara API includes, why we built it, and what customers made in the first weeks.
Read more

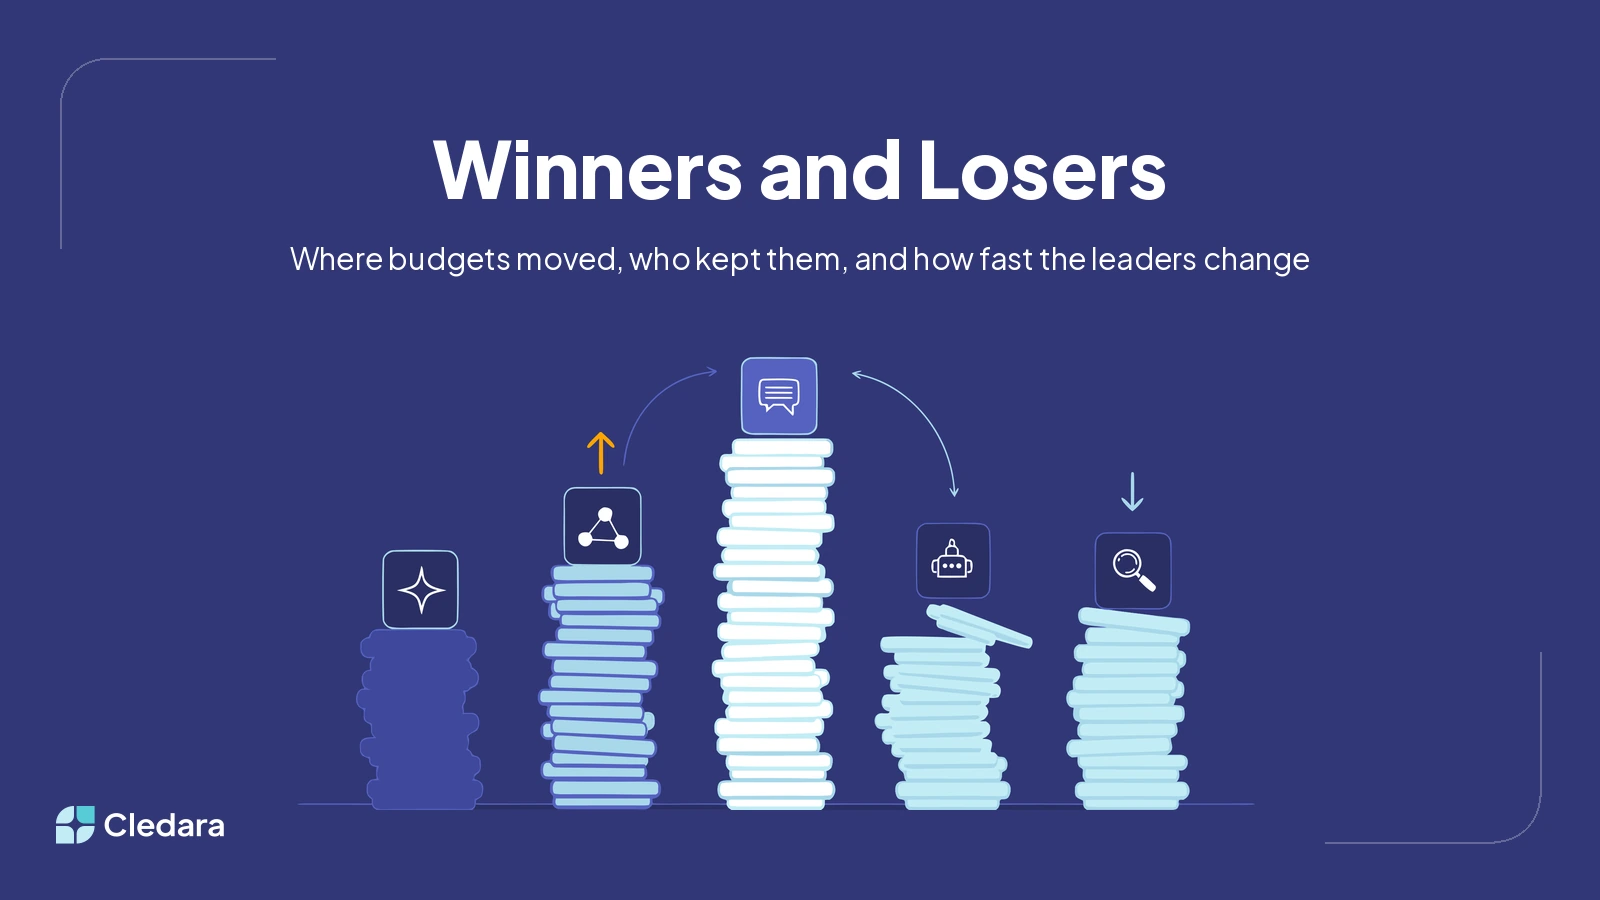
AI Software Spend in Q3 2026: Winners, Losers, and a Market That Flips in Months

Payment data across thousands of software vendors shows AI at 10% of software spend, which AI tools are winning and losing budgets, and why the rotation is so fast.
Read more
Hero image: a glowing virtual payment card at the centre of six connected accounting platform screens

Cledara Works With Every Accounting Platform and ERP: Here's How

Cledara works with every accounting platform and ERP: Xero, QuickBooks Online, NetSuite and Tripletex through native integrations, and everything else, from Sage and Microsoft Dynamics to AI-native ledgers like Light and Rillet, through white label accounting. This guide explains how both integration paths work, what actually syncs, what that does to month-end, and how to switch accounting platforms without breaking payments or losing history, with a full integration table and a five-step ledger migration checklist.
Read more
Stylised American flag with stripes drawn as market share bars, surrounded by software app tiles on a deep indigo background

US SaaS Market Share 2026: America Owns 75% of Software Spend

US-headquartered software vendors accounted for 74.8% of tracked SaaS market share in July 2026, up from 72.4% two years earlier. Cledara data shows UK companies send 75.1% of software spend to US vendors and only 6.9% to British ones.
Read more

What Sales Teams Actually Spend on SaaS: The Data Behind Every Tool

Sales teams represent 5.8% of tool adoption but 10.9% of spend. Real data on what sales teams buy and what it costs.
Read more

Shadow AI: The Finance Leader's Guide to Managing Unsanctioned AI Spend

Shadow AI is one of the fastest-growing categories of unmanaged software spend. This guide breaks down why shadow AI is primarily a finance problem (not just a security concern) and provides a practical 4-step framework for discovering, quantifying, governing, and optimising AI spend.
Read more

SaaS Renewal Benchmarks 2026: When to Negotiate, Switch, or Cancel

SaaS vendors are raising prices 8-12% annually, with aggressive vendors hitting 15-25%. This guide breaks down renewal decision-making by timing, negotiation leverage, switching costs, and category benchmarks.
Read more

How to Run a SaaS Audit in 5 Steps

A SaaS audit is the fastest way to find wasted software spend, close compliance gaps, and eliminate redundant tools. This step-by-step guide walks finance leads and IT managers through the complete process.
Read more

Moss vs. Cledara: 2026 Comparison for SaaS Spend Management

An honest comparison of Moss and Cledara for managing SaaS spend. Discover why tech companies are choosing Cledara over Moss for software subscription control.
Read more

Average SaaS Spend Per Employee in 2026: The Definitive Benchmark

Based on analysis of 1.8M+ SaaS purchases across 6,800+ tools in 87 countries, we reveal the definitive benchmark for per-employee SaaS spending by region, company size, and industry. US companies average $349K annually; UK $209K; Europe $167K. Learn how company size, category mix, and AI adoption impact your per-employee costs.
Read more

Why Your Company Needs SaaS Management

The median company has 25 SaaS subscriptions. The top 10% have 49 or more. Here is why every company needs SaaS management.
Read more

UK vs US vs Europe: How SaaS Spending Differs by Region

US companies spend $349K on SaaS per year on average, nearly double the UK. Here is how software purchasing patterns differ across regions.
Read more

AI is Eating the SaaS Budget: How AI Tools Went from 8.8% to 26.4% of All Purchases

AI tools grew from 8.8% to 26.4% of all SaaS transactions in just 14 months. Here is what the spending data reveals about the AI takeover.
Read more

The Controller’s Guide to SaaS Expenses: Amortization, Accruals, and the End of the Spreadsheet

Struggling with SaaS accruals and prepaid amortization? This guide covers the accounting rules for software subscriptions (ASC 606/350-40), the risks of spreadsheet schedules, and how to automate your month-end close.
Read more