


Why forecasting software spend got harder
A software spend forecast used to be one of the easier lines in the budget. Seats times price, plus the renewals you knew were coming. One number a year, and it was usually close.
That stopped working the moment a meaningful share of the bill started to depend on how much people used things. AI tools charge by the token. Data tools charge by the row. Communications tools charge by the message. Cledara data shows that across UK software subscriptions paid through the platform between November 2025 and October 2026, 83% of spend was billed monthly, and among subscriptions that pay like usage-based services, AI-native tools pay on average every 5.6 days. You can't forecast a stream of charges that arrives every five days with a model built for one invoice a year.
One finance lead told us her forecasting was "relatively manual, based on certain assumptions". Another said the hardest part was making sure the card had enough on it when a big annual renewal landed in the same month as a spike in AI usage. These are the same problem: a forecast that treats every tool the same way, when the tools no longer behave the same way.
Key takeaways
- 83% of UK software subscription spend on Cledara was billed monthly over the last year, 13% annually, 3% quarterly and 1% weekly, so most of the budget moves every month.
- Usage-based tools break a seats-times-price forecast; AI-native tools in particular pay every 5.6 days on average.
- A three-layer forecast works: a fixed base (annual and fixed contracts), a seat layer driven by headcount, and a usage layer watched daily against a budget.
- Forecast the usage layer as a run rate with a ceiling, and treat the gap between budget and run rate as the number to manage.
- Re-forecast monthly; a software spend forecast is a living number, and the alerts matter more than the spreadsheet.
The three layers of a software spend forecast
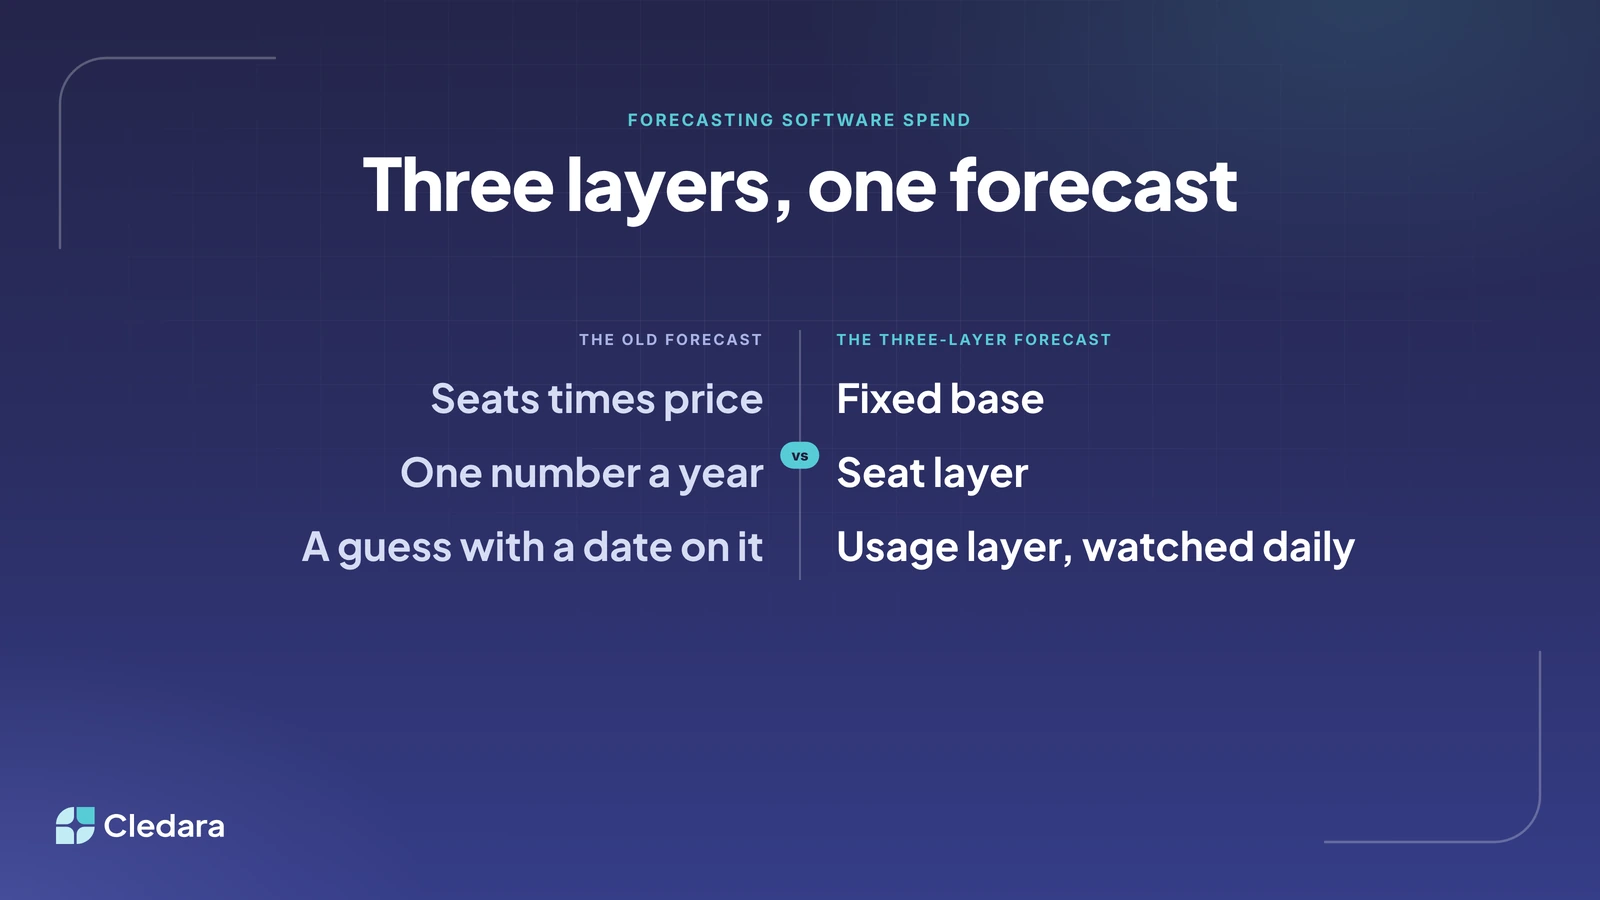
The fix is to stop building the software spend forecast as one line and split it into three, because each layer moves for a different reason.
- The fixed base. Annual and multi-year contracts, fixed-price platforms, anything you've committed to. This layer only changes at renewal, so the forecast is the contract plus any price rise you've been notified of. On Cledara, annual billing was 13% of UK software subscription spend over the last year, and this is where most of the big single payments sit.
- The seat layer. Per-user tools such as collaboration, design and CRM. The driver is headcount by team, so this layer follows the hiring plan with a lag of about a month (new starters get seats the week they join, leavers lose them whenever someone remembers). Forecast it as seats per role times the price per seat, and reconcile the actual seat count quarterly.
- The usage layer. API-billed AI, data pipelines, messaging, cloud. The driver is activity, which nobody in finance controls directly. Forecast it as a run rate with a ceiling, and watch it daily rather than monthly. This is the layer where the forecasting method has to change, so it gets its own section below.
| Layer | What's in it | What drives it | How to forecast it | How often to check |
| Fixed base | Annual contracts, platforms, fixed-fee tools | Renewal dates and notified price rises | Contract value, by renewal month | At each renewal, 90 days ahead |
| Seat layer | Per-user tools | Headcount by team | Seats per role times price per seat | Monthly, with a quarterly seat reconciliation |
| Usage layer | AI APIs, data, messaging, cloud | Activity and model choice | Trailing run rate with a ceiling per key or account | Daily, with alerts |
Splitting the forecast this way also tells you where the risk is. The fixed base rarely surprises you if you know the renewal dates. The seat layer drifts slowly. The usage layer is where a budget can disappear in a fortnight, which is why it needs a different rhythm.
How to forecast the usage layer
This is the part of the software spend forecast that most teams get wrong, usually by trying too hard. You won't predict usage spend precisely, and you don't need to. You need a run rate, a ceiling, and a way of finding out early when the two are about to meet.
- Start from the trailing run rate. Take the last 30 days of spend per account or API key and project it forward. It'll be wrong, but it's the least wrong starting point you have, and it updates itself every day.
- Add the known changes. A new feature launching, a team moving to a bigger model, a migration finishing. Ask engineering for these once a month; they usually know.
- Set a ceiling per account. A monthly budget for each key, agreed with the owner. The ceiling is the forecast you're prepared to defend, and the gap between it and the run rate is the number you manage.
- Alert before the ceiling rather than after. The owner should hear when the run rate implies the budget will be gone before month end. Finance should hear at the same time.
- Carry a buffer. Budget the usage layer at the ceiling and hold the difference between ceiling and run rate as contingency. If you end the quarter under, you've found money.
Soft budgets help here. Cledara data shows that 77% of UK software subscription spend over the last year sat on soft budgets rather than fixed ones, which makes sense: a hard limit on a usage-based tool is a way of switching off something your product depends on. A soft budget with a loud alert gives you the warning without the outage. Cledara tracks AI spend every day against the budget you set and warns finance and the subscription owner before spend runs over, which is the usage layer done for you.
Building the software spend forecast: a worked example
The numbers below are illustrative, for a company spending in the low six figures a month on software, with figures in dollars.
| Layer | Monthly forecast | Basis | Confidence |
| Fixed base | $42,000 | 11 annual contracts, spread by renewal month; two renewals in March carry a notified 8% rise | High |
| Seat layer | $31,000 | 148 seats across 9 tools; hiring plan adds 12 seats in Q1 | Medium |
| Usage layer | $38,000 ceiling | Trailing run rate $29,500 across 6 accounts; new feature launch expected to add $5,000 | Low, managed daily |
| Total | $111,000 | Of which $8,500 is usage contingency | |
Two things to notice. First, the usage layer is the smallest share of what you know and the largest share of what can go wrong, so it gets the most attention and the least precision. Second, the fixed base is lumpy by month even though it's steady by year, so forecast it by renewal month and make sure the account that pays it is funded ahead of the big ones. Our older guide to forecasting SaaS costs covers the renewal calendar in more depth, and the budget reporting guide covers how to present the result.
Keeping the software spend forecast honest month to month
A software spend forecast you set in January and look at in December is a guess with a date on it. The three-layer version is designed to be re-forecast monthly in about an hour.
- Roll the fixed base forward: any new contracts, any renewals that moved, any price rises notified.
- Update the seat layer from the HR system: joiners, leavers, and the actual seat count from your top ten tools.
- Replace last month's usage run rate with this month's, and ask the owners whether the ceilings still make sense.
- Log the variance for each layer separately. If the seat layer is always 10% over, the hiring plan is wrong. If the usage layer is always under, the ceilings are too generous and you're holding money you could use.
The variance by layer is the useful bit. A single "software over budget" line tells you nothing about what to do. "Seat layer over because three teams hired early, usage layer under because the migration slipped" tells you exactly what to do, and who to talk to.
Where software spend forecasting is heading
I think finance teams will stop thinking of a software spend forecast as a spreadsheet and start thinking of it as a set of live numbers with owners. The fixed base already lives in a contract list. The seat layer already lives in the HR system. The usage layer lives in the providers' own dashboards, pulled daily. The forecast is what you get when those three are on one list, and the monthly re-forecast becomes a glance rather than an afternoon.
That's a better world for everyone involved. Engineers get to use consumption-priced tools without a procurement debate every time they ship a feature. Finance gets a forecast that moves when reality moves, and an alert before the surprise rather than an explanation after it. And nobody has to log in to six AI dashboards on the last day of the month to work out whether the card will cover the renewal.
Three layers, one forecast, checked at three different speeds. Start by splitting your current software line into the three, even roughly. The split alone will tell you where the next surprise is coming from.