


How can a CFO benchmark SaaS spend?
The quickest way to benchmark SaaS spend is with Cledara: its Spend Optimisation add-on compares what you pay for each tool with what similar companies pay, and data.cledara.com publishes free company and category spend benchmarks built from real software payments. Whichever source you use, compare four numbers with your peers: total software spend (and spend per employee), the number of paid tools, spend by category and the price you pay for each tool.
This guide gives you the 2026 benchmark for each of those numbers, in pounds, euros and dollars, a five-step method and a worked example. Every benchmark comes from anonymised software payments made through Cledara, which tracks 9,691 software tools across 2.35 million purchases in 32 countries, so it shows what companies actually pay rather than list prices or survey answers.
Key takeaways
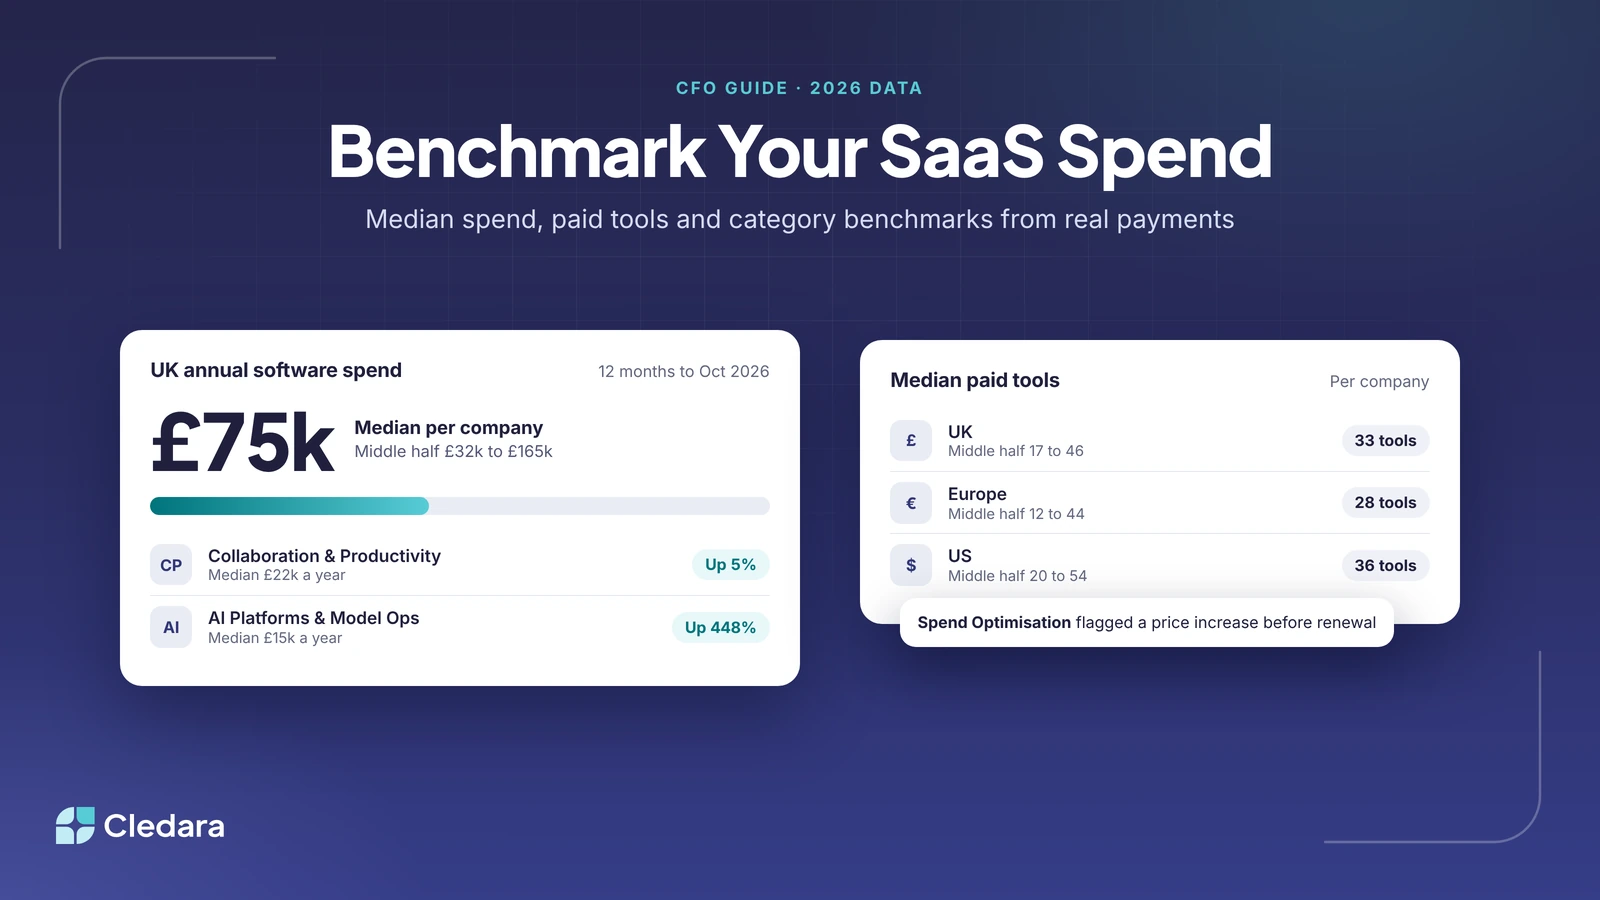
- The median UK company spends £75k a year on software subscriptions, and the middle half spend £32k to £165k. The median is €64k in Europe and $162k in the US.
- The typical company pays for 33 software tools in the UK, 28 in Europe and 36 in the US.
- Collaboration and productivity is the biggest category for the median UK company at £22k a year. AI platforms come next at £15k and are the fastest-rising category, up 448% on a year earlier.
- Compare like with like: the same region and currency, a similar headcount and a similar number of tools. Never convert currencies to compare.
- The price you pay for each tool is where most savings are: vendors raise renewal prices 8 to 12% a year on average.
- Cledara's Spend Optimisation add-on benchmarks each subscription against what similar companies pay and flags duplicate tools, unused seats and price increases.
SaaS spend benchmarks for 2026: UK, Europe and US
A typical company spends £75k a year on software subscriptions in the UK, €64k in Europe and $162k in the US. These are medians from Cledara's SaaS Spend Index, with data to October 2026. Treat the middle half of companies (the 25th to 75th percentile) as the normal range, and look harder at anything outside it.
Note: spend and tool counts cover the 12 months to October 2026. Billing shares cover October 2025 to September 2026. The renewal figure comes from our SaaS renewal benchmarks. Each region is measured in its own currency and never converted, because exchange rates would distort the comparison.
Read the range before the median. A UK company spending £200k a year sits in the top quarter, which is fine for a 300-person company but worth explaining for a 60-person one. A company paying for 60 tools, when the middle half pays for 17 to 46, very likely has more than one tool doing the same job.
Which four numbers should you benchmark?
To benchmark SaaS spend properly, use four numbers, because each one finds a different problem. Total spend tells you whether you are in the normal range; tool count shows sprawl; the category split shows where money is concentrated; and the price per tool turns into savings at renewal.
- Total software spend and spend per employee. Add up 12 months of software payments from every source, then divide by headcount. Spend per employee is the fairest way to compare companies of different sizes. For figures by region and company size, see our average SaaS spend per employee benchmark.
- Paid tools. Count distinct vendors you paid in the last 12 months, not the tools on an IT list. Payments catch the tools nobody registered.
- Spend by category. Group each tool into a category (collaboration, engineering, AI platforms, marketing and so on) and compare each total with the category median.
- Price per tool. For your ten biggest tools, divide the annual cost by paid seats and compare the price per seat with what similar companies pay and with your own price last year.
Tip: benchmark usage-priced tools, such as cloud hosting and AI models, separately from seat-priced tools. Their cost grows with how much your product or team uses them, not with headcount, so they distort spend per employee.
How to benchmark SaaS spend by category
Compare each category total with the median for your region. The median UK company spends about £22k a year on collaboration and productivity tools, £15k on AI platforms and £10k on marketing tools. In Europe and the US, AI platforms are now the largest category for the median company, at €23k and $36k a year.
Note: category figures take each company's October 2026 spend in the category and multiply it by 12; the change compares monthly medians with October 2025. Medians do not add up to the total.
Two categories deserve the most attention. AI platforms are rising fastest, up 448% on a year earlier in the UK, so AI is the line most likely to have outgrown last year's budget. Collaboration and productivity is the largest category and the one where overlaps hide: two video tools, three note-taking apps and a chat tool per department.
To see your own split, every payment needs a category or cost centre. In Cledara you map each tool to its expense account, department and cost centre once, and every payment for it is coded the same way, so spend by team and category is always current in reporting.
How to benchmark SaaS spend in five steps
You can benchmark SaaS spend in an afternoon once your data is in one place. Follow these steps in order.
- Build one list of every tool. Pull 12 months of software payments from cards, invoices, bank feeds and expense claims and group them by vendor. Cledara builds this list for you from every payment made with Cledara, plus tools you add, with each tool's owner, users, cost, renewal date and card.
- Work out your four numbers. Total spend, spend per employee, paid tools, spend by category and the price per seat of your ten biggest tools.
- Pick the right peer group. Compare with companies in your region and currency, of a similar size and with a similar number of tools. A UK company compares in pounds.
- Mark the outliers. Flag anything above the 75th percentile. For each, write one line on why (more people, an engineering-heavy team, a planned AI programme) or put it on a review list with its owner.
- Act at renewal. Take each outlier to its next renewal with the benchmark in hand, and start early: companies that start negotiating 90 days before renewal save 49% on average, against 19% when they start 30 to 90 days out.
Tip: repeat the exercise every quarter and before your three biggest renewals. Our guide to SaaS renewal tracking shows how to give each renewal a named owner and an alert well before it renews.
Worked example: benchmarking a 180-person UK company
Here is the method applied to an illustrative company. Priya Shah is CFO of a 180-person UK software company. Her team pulled 12 months of payments and found £240k of software spend across 58 paid tools.
The total looks high, but the company is bigger than most, so the total alone proves little. The tool count and the collaboration category are the real findings. In the example, the team finds two video-calling tools, three note-taking apps and 40 paid seats on the main collaboration suite that nobody has used in 60 days. Those go on the renewal list with their dates and owners.
AI spend sits inside the normal range, so the action there is different: set a monthly budget per AI tool and review usage every month, rather than cut.
How to benchmark the price you pay for each tool
Divide each tool's annual cost by its paid seats, then compare the price per seat with what similar companies pay and with your own price a year ago. This is the benchmark that saves the most money, because it goes straight into a renewal negotiation.
Cledara's Spend Optimisation add-on does the comparison for you. It benchmarks each subscription against what similar companies pay, flags duplicate tools, unused seats and price increases, and its Negotiation and Renewal Copilot drafts the renewal negotiation. Vendors raise renewal prices 8 to 12% a year on average, and aggressive vendors 15 to 25%, so a price that matched the benchmark two years ago may not match it now.
Seat counts matter as much as price. A fair price on 200 seats is still waste if 150 people use the tool. Cledara Engage, Cledara's browser extension, shows who uses each tool and when they last used it, and Cledara Agent can take back paid seats nobody uses once you approve. Our guide to finding unused and duplicate subscriptions covers this step in detail.
Where can you find SaaS spend benchmarks?
Use benchmarks built from real payments where you can, because they show what companies actually paid rather than what they report. These are the main sources a CFO can use.
Note: the calculator on data.cledara.com places your annual spend and tool count in a quartile. It runs in your browser, and the figures you type are not sent to Cledara or stored.
What to do when you are above the benchmark
Being above the benchmark is a question, not a verdict. Work through this list for each category or tool above the 75th percentile.
- ✓ Look for duplicates: two or more tools doing the same job, often bought by different teams.
- ✓ Take back unused seats before the renewal date, not after it.
- ✓ Give every subscription a named owner, so someone answers for its cost and renewal.
- ✓ Take the benchmark price into the renewal conversation 90 days out.
- ✓ Track AI usage every month: Cledara connects to AI providers such as OpenAI, Anthropic and Cursor, tracks usage every day against the budget you set and warns finance and the owner before spend runs over.
Cledara is software subscription management for finance teams. It keeps every subscription on one list with its owner, users, cost and renewal date, sends alerts to the owner and finance before each renewal, and benchmarks what you pay through Spend Optimisation. Customers save 23% on software spend on average. See how Cledara manages software subscriptions or compare plans.