
"How much should we be spending on SaaS per employee?"
It’s the question keeping finance leaders and founders awake at night. In an era where software is the backbone of every department, the answer is a survival metric. Based on analysis of real transaction data from nearly 1.8 million purchases across over 6,800 SaaS tools in 87 countries, we can now answer this question with precision. Here's what the data reveals about SaaS spending patterns in 2026.
The Per-Employee SaaS Spend Benchmark by Region
SaaS spending varies dramatically by geography, reflecting differences in business practices, regulatory requirements, and technology adoption rates.
- United States: Average annual spend of $349,000 on SaaS tools. For a 50-person company, this breaks down to approximately $6,980 per employee per year, or roughly $580 per month. For a 100-person company, the per-employee figure drops to $3,490.
- United Kingdom: Average annual SaaS spending sits at $209,000, translating to about $4,180 per employee annually for a 50-person organization. This 40 percent lower spending than the US reflects both smaller average company sizes and different technology adoption patterns.
- Europe: The benchmark is even lower at $167,000 annually. For a typical 50-person company, this equals approximately $3,340 per employee per year. European companies tend to be more conservative with SaaS adoption, often favoring on-premises solutions or regional alternatives.
These figures underscore an important principle: your regional location is one of the strongest predictors of your SaaS spending baseline. If you're in the US, expect higher per-employee costs. If you're in Europe, budget accordingly for lower benchmarks.
How Company Size Affects Per-Employee SaaS Costs
Does more employees mean more efficiency? Generally, yes, until you hit the enterprise level.
- The Startup Phase (10 people): High per-head costs (approx. $150/mo) because core tools (Slack, Notion, etc.) aren't spread across many users.
- The Sweet Spot (50–500 people): Efficiency kicks in. Shared platforms bring costs down to $250–$350 per employee/month.
- The Enterprise Paradox: At the very top, costs often rise again. Large firms pay premiums for "Enterprise Grade" security, complex compliance modules, and specialized legacy integrations that smaller companies skip.
The Per-Employee Breakdown by Category
Understanding where your per-employee SaaS budget goes is essential for optimization. The data reveals a clear hierarchy.
Collaboration and productivity tools (Slack, Microsoft Teams, Notion, etc.) dominate, accounting for 34.3 percent of all SaaS spending. For a company spending $6,000 per employee annually, roughly $2,058 goes to collaboration tools.
Engineering tools represent the second major bucket at 16 percent of spending. This includes development platforms, CI/CD tools, code repositories, and testing software. Engineering-heavy organizations often skew higher in this category.
Marketing technology tools account for 13.3 percent of per-employee spend. Depending on company size, this might be concentrated in a few people or distributed across a large team.
The remaining categories, Sales, Finance, HR, and Other, collectively represent approximately 36.4 percent of spending. The distribution here varies dramatically by industry and company function.
The insight here is critical: if your collaboration tool spending exceeds 45 percent of your SaaS budget, you're likely overspending on commoditized tools. If your engineering spending is below 10 percent but you employ engineers, you may be underinvesting in development tooling.
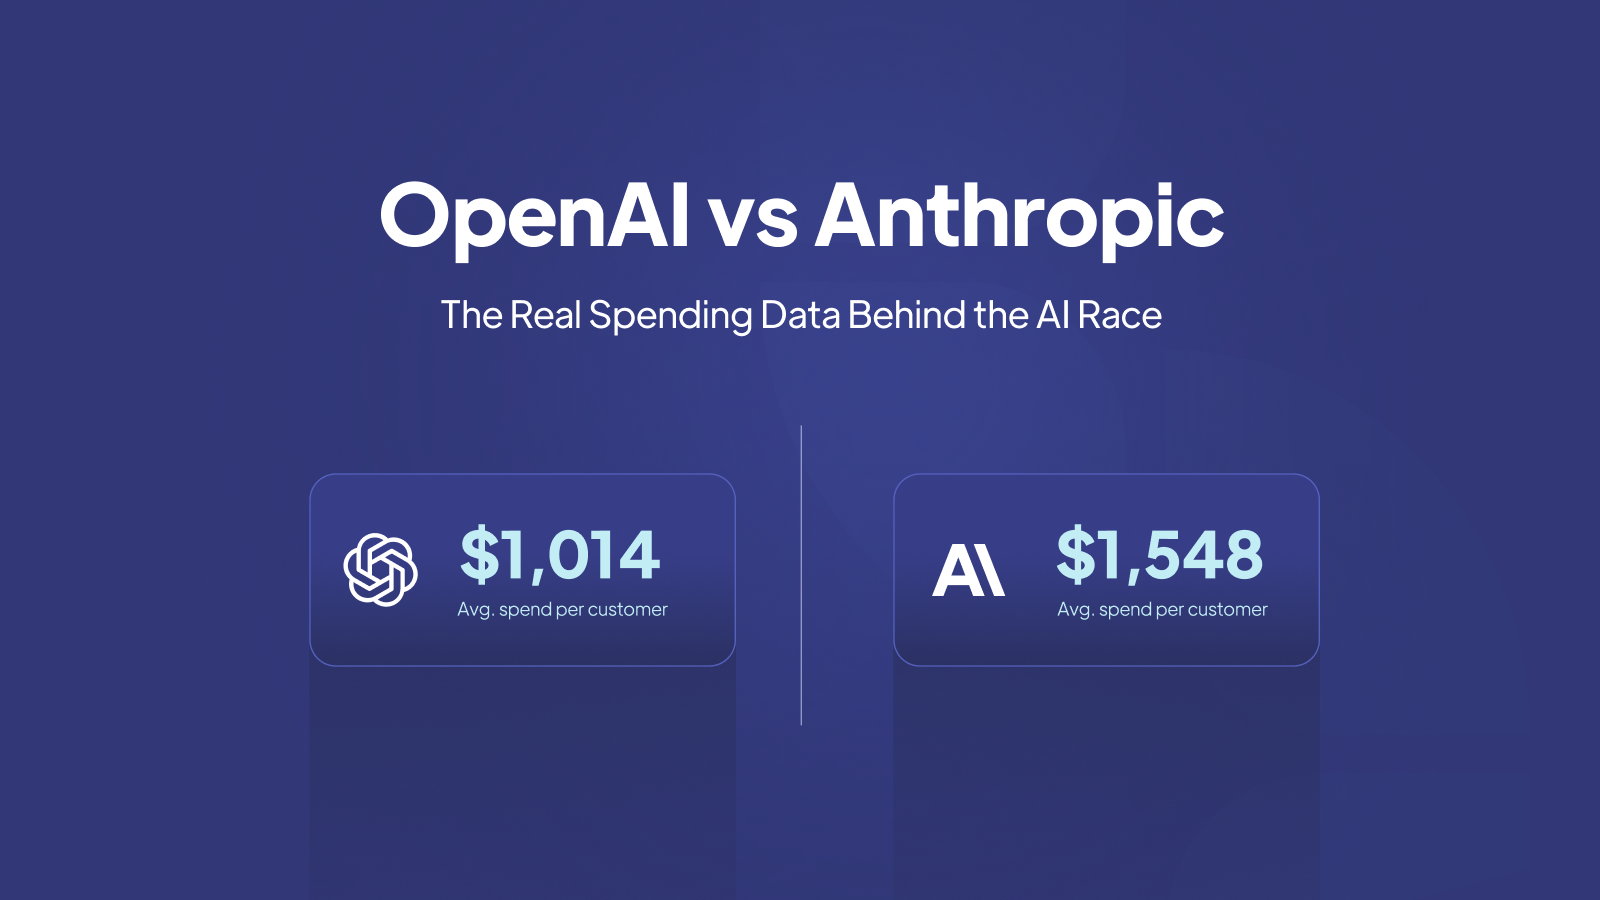
The AI Revolution's Impact on Per-Employee Costs
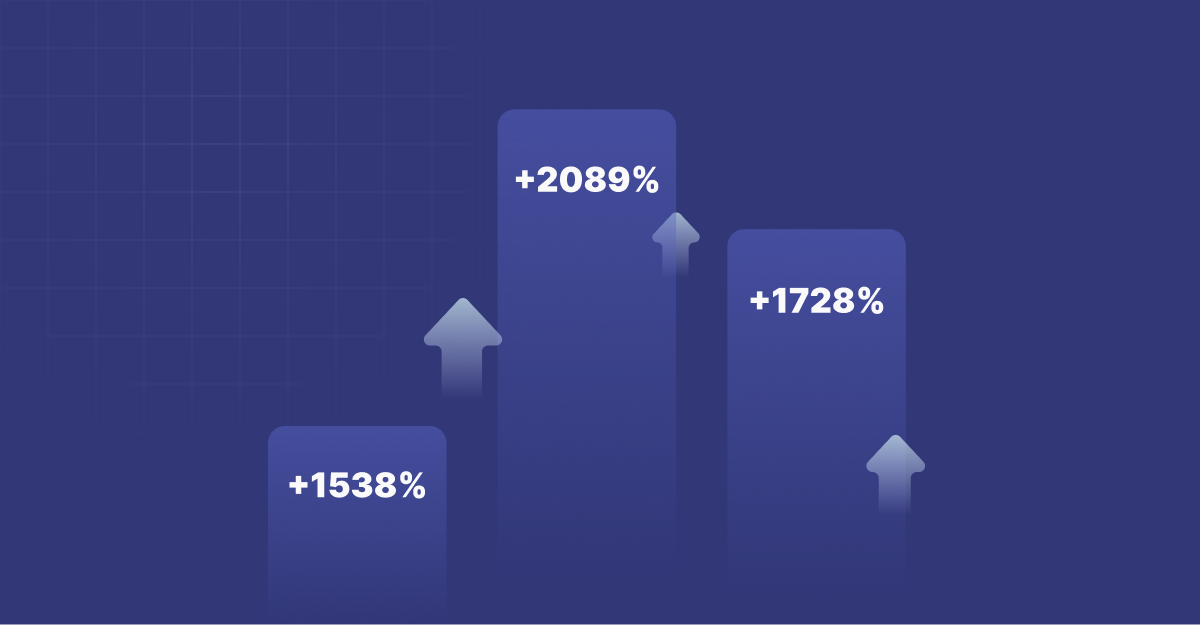
Perhaps the most significant trend in 2026 is the explosion of AI tool adoption. In April 2025, AI tools represented 8.8 percent of all SaaS purchases. By March 2026, just 11 months later, AI had grown to 26.4 percent of all purchases.
This explosive growth means that per-employee SaaS costs are rising, but not always in visible ways. Many organizations are adding AI tools as supplementary purchases rather than replacing existing software. A marketing team might add ChatGPT Plus alongside HubSpot. An engineering team might add GitHub Copilot alongside existing development tools.
The practical impact on your per-employee budget: expect to allocate 15-25 percent of new SaaS spending to AI capabilities over the next 12-24 months. This isn't necessarily waste; many organizations report significant productivity gains. But it's a factor that wasn't relevant in previous benchmarks.
Companies that proactively consolidate AI capabilities into fewer platforms may be able to offset these costs. Those that proliferate point solutions will see per-employee spend rising.
The Subscription Tsunami
SaaS sprawl is accelerating at an alarming rate. In early 2025, companies added an average of 53 new subscriptions per month. Today, that number has jumped to 401.
While the median company runs 25 active subscriptions, the most tech-aggressive firms are managing 49+. This sevenfold increase in new additions suggests that per-employee costs will likely spike in the next 6-12 months as these "trial" tools convert to full enterprise licenses. If your organization isn't actively managing SaaS spend, expect your per-employee costs to rise faster than this baseline growth rate.
Action Plan: Navigating Your 2026 Budget
- Find Your Peer Group: Compare yourself by industry (e.g., Finance spends $10k+ per head, while Manufacturing stays closer to $2k).
- Audit for "Shadow" Spend: Calculate your actual per-head cost. It is almost always higher than Finance thinks.
- Manage Proliferation: With subscription additions up 7x, you need a formal approval process yesterday.
As subscriptions explode from 53 to 401 per month, the "manual" way of managing software is officially broken. You can't optimize what you can't see, and in 2026, what you don't see is costing you thousands per employee.
This is where SaaS Management becomes your competitive advantage.
SaaS Management is the practice of proactively monitoring, controlling, and optimizing your entire software ecosystem. Instead of reacting to a surprise $50,000 renewal, you gain:
- Complete Visibility: See every app, every user, and every dollar in one dashboard.
- Automatic Cost Savings: Identify duplicate tools (like paying for both Zoom and Teams) and reclaim unused licenses instantly.
- Compliance & Security: Ensure every tool meets your security standards before it’s even purchased.
How Cledara Can Help
Cledara is the all-in-one SaaS Management platform designed to bring order to the chaos. By combining a centralized purchasing system with real-time tracking, Cledara helps you hit those per-employee benchmarks with ease. We help you cancel what you don't use, negotiate what you do, and ensure your 2026 AI investments actually drive ROI, not just sprawl.