


Why unusual spending changes are so hard to spot
Here's a funny thing about software spend. Almost none of it arrives as one big surprise. It arrives as dozens of small, reasonable-looking charges, and the job of a finance team is to spot unusual spending changes inside that noise before they turn into a number the board asks about. Software subscription management platforms like Cledara exist to make that job automatic, by keeping one list of every tool, its owner, its cost and its renewal date, and flagging the moment something moves.
The median company on Cledara pays for 32 software tools, and 90% of software transactions are monthly subscriptions. So the typical finance team is watching dozens of recurring charges, each of which can quietly change price, quantity or owner without anyone telling finance.
Key takeaways
- Six signals cover most of it: a price rise at renewal, seat creep, a new vendor, a duplicate tool, a usage overage and a leaver still being billed.
- Each has a threshold that catches it early and shows up in a different place: the card statement, the invoice, the usage data or the HR system.
- Renewal prices rise 8 to 12% a year on average, and 15 to 25% with aggressive vendors, so "same tool, bigger charge" is the most common unusual change of all.
- 27% of software spend on Cledara now goes to AI-native tools, much of it billed on usage, which is where the biggest month-to-month spikes come from.
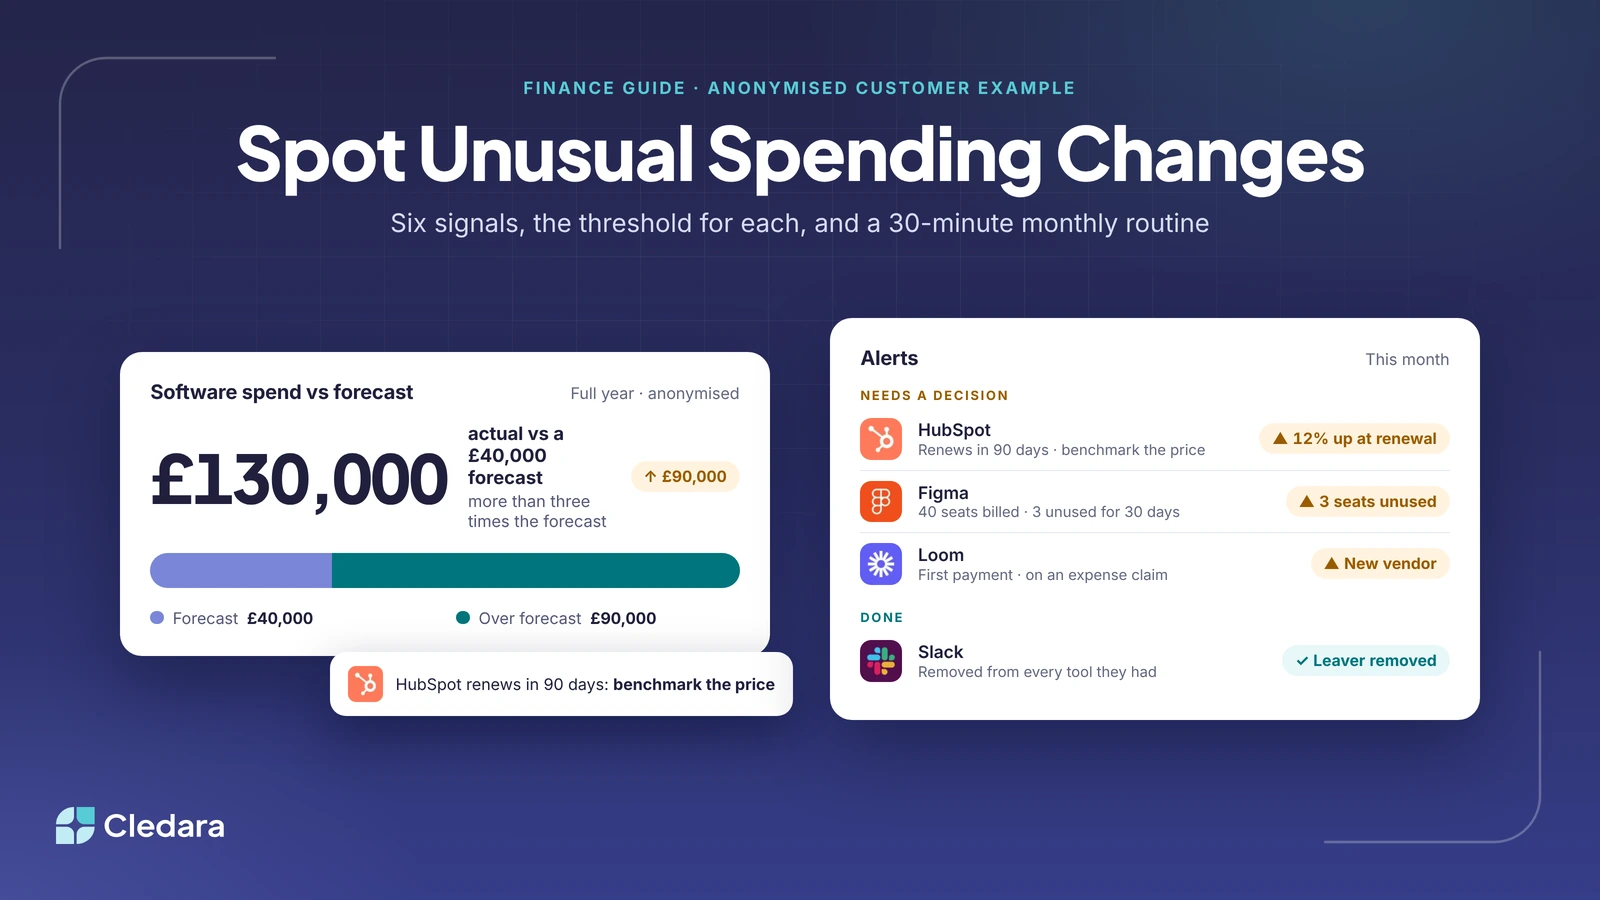
- Forecast misses are many small drivers stacked up, not one villain. One of our customers found a £40,000 forecast was really £130,000 of actual spend.
- A platform that holds every tool, payment and invoice in one list can spot unusual spending changes for you, and a 30-minute monthly routine catches the slow ones.
What kinds of platforms help finance teams spot unusual spending changes across cards, invoices and reimbursements?
Platforms that see all three in one place. A card tool sees the charge. An accounting system sees the invoice. An expense tool sees the claim. To spot unusual spending changes you need the charge, the invoice and the usage behind it side by side, and that's what a software subscription management platform does.
In practice that means four things: one list of every software and AI tool with its owner, users, cost and renewal date, built from the payments themselves; a virtual card per subscription with its own limit, so a charge that doesn't fit stands out; the invoice matched to each payment, so a change in unit price or quantity shows on the line items; and usage data, so you can tell growth from nobody turning something off.
The unit of analysis is the subscription, not the transaction. A card statement shows a payment went from, say, £1,200 to £1,380. A subscription view shows this is the renewal, it's 15% up, notice is 60 days, and 12 of the 40 seats haven't been used in a month. One of those is a line on a statement. The other is a decision.
Note: Cledara is one example. It keeps one list of every tool, gives each subscription its own virtual card (free on every plan), collects invoices and syncs them to Xero, QuickBooks, NetSuite or Tripletex, and its Spend Optimisation module benchmarks prices against similar companies and flags duplicates, unused seats and price increases.
The six signals finance teams use to spot unusual spending changes
Most unusual spending changes in software come down to six patterns. Each has a threshold that catches it early, a place where it first shows up, and an obvious action once you've seen it. The thresholds below are a sensible starting point rather than a law.
Price rises at renewal
This is the signal the data says to watch first. Renewal prices rise 8 to 12% a year on average, and 15 to 25% with aggressive vendors (our 2026 renewal benchmarks have the detail). That makes "same tool, same seats, bigger number" the most common unusual change you'll see, and the easiest to miss, because it looks like last month's charge with a bit added. Timing is the threshold that matters: companies that start negotiating 90 days before renewal average 49% savings, against 19% for those that start 30 to 90 days out. Spot the rise when the card is charged and you've already lost your negotiating position. We wrote up which vendors raise prices at renewal and what their cancellation terms say if you want the specifics.
Duplicate tools
Duplicates don't look unusual at all, which is the problem. Each payment is normal on its own; it's only when you line the list up by category that you see two tools doing one job. In Cledara's data, 69% of companies paying for Zoom also pay for Google Workspace, and 75% of companies paying for Canva also pay for Adobe. Some of that is deliberate (fair enough) and some is two teams buying the same thing a year apart. what3words cut software spend by over 10% by catching duplicates, and the method is in our guide to unused and duplicate subscriptions.
How can I identify cost drivers behind a sudden increase in SaaS licence spend versus forecast?
Break the variance into the six signals above and work through them per tool. A forecast miss on software is almost never one cause. It's a stack of small, reasonable changes nobody added up, and the way to spot unusual spending changes behind a big variance is to decompose it, not stare at the total.
Here's the example that made this real for me. One of our customers hired a new finance lead, who inherited a software forecast of £40,000 for the year. When they pulled the actual spend from the cards and the ledger, it came to £130,000. More than three times the forecast, £90,000 nobody had planned for, and the board had already mandated a cut before anyone knew where the money was going. True story, and not an unusual one.
When a number is that far off, the drivers are nearly always these:
- Tools that weren't in the forecast at all. Bought on a personal card and expensed, or by someone who didn't think of it as "software". Jiminny's finance team captured an extra 15% of subscriptions it didn't know it was paying for once everything ran through one list (their story is here).
- Seats that grew with headcount but never shrank with it. The forecast assumed last year's seat count. The invoices show this year's, plus every leaver who was never removed.
- Renewals that went through at the new price. An 8 to 12% rise on each of 32 tools is a meaningful chunk of budget, and it's invisible if the forecast rolled last year's spend forward.
- Usage-billed AI. 27% of software spend on Cledara now goes to AI-native tools, up from about 3% two years ago, and AI-native spend in the UK between August and October 2026 was 25% higher than the three months before. A lot of that is billed on usage, so a team that got productive with an AI tool in March can double its bill by June without buying anything new.
- Annual plans landing in a single month. In Cledara's UK data for May to October 2026, the largest payment spikes on individual subscriptions were in customer support, collaboration, IT and security, HR and AI platform tools, and the biggest was more than 400 times that subscription's trailing median monthly payment. Most look like an annual invoice landing on a tool that had been paying monthly: a forecasting problem rather than a spending one, but it blows up the variance all the same.
Tip: Decompose per tool, not per category. "Marketing software is over budget" tells you nothing you can act on. "HubSpot came back 12% up at renewal, three Figma seats are unused, and someone's expensing Loom" is a to-do list.
How platforms that track SaaS usage and spending automatically spot unusual spending changes
By comparing three things that normally live in three systems: what you're paying, how many people are using it, and what the contract says. Platforms that track SaaS usage and spending automatically run that comparison every day, so each threshold in the table is a rule that fires rather than a check someone has to remember.
Usage is the part most finance teams don't have. The card says what was paid and the invoice says how many seats were billed, but neither says how many of those seats did anything last month. Cledara Engage, our browser extension, shows which of 8,000+ tools people actually use (it collects only a username and a timestamp, never browsing history or passwords). Set that against the invoice and seat creep stops being a guess.
For AI tools the comparison runs daily, because usage billing moves faster. Cledara connects to OpenAI, Anthropic and Cursor, tracks usage every day against the budget you set, and warns finance and the subscription owner before spend runs over. Our guide to AI spend management tools goes through the options for several providers.
Then there's the step after you spot unusual spending changes. Finding 12 unused seats is useful; having them taken back is the point. Cledara Agent, an add-on for any plan, signs in to the tools you connect and takes back paid seats nobody uses, removes leavers from every tool they had, and collects the invoices nobody emails you. Each change waits for your approval unless you set a standing approval. You just approve.
A monthly routine to spot unusual spending changes in 30 minutes
Alerts catch the sharp changes. A short monthly routine is how finance teams spot unusual spending changes that creep. This is the version that works for the teams we talk to, and it takes about half an hour once the list is in place.
- ✓ Sort every subscription by change in cost against the previous period, and look at anything that moved more than 8%.
- ✓ List every renewal in the next 90 days with its current price, last year's price and notice period, and open the benchmark for each one.
- ✓ Pull first-time vendors from the month's payments and expense claims, and give each one an owner or a cancellation.
- ✓ Compare seats billed with seats used for your ten biggest tools, and take back anything unused for 30 days.
- ✓ Set the HR system's leaver list for the month against each tool's user list, and remove anyone still there.
- ✓ Check every usage-billed AI and cloud tool against its budget, and ask the owner about any month more than three times the trailing median.
- ✓ Group the list by category, look for two tools doing one job, and update the forecast per tool with what you found.
Key takeaway: the routine gets shorter every month, because each thing you catch becomes a rule. A leaver removed in week one never becomes a leaver still billing in month six.
How do businesses prevent fraudulent or duplicate reimbursements for software?
Mostly by making sure software never goes through reimbursements in the first place. The cheapest reimbursement anomaly to spot is the one that can't happen: if every subscription has its own virtual card, limit and owner, there's no reason for a tool to end up on anyone's personal card and expense claim.
Where a software charge does show up on a claim, treat it as a new-vendor signal: it either belongs on the list with an owner and a card, or it shouldn't be paid for at all. When every payment is matched to one invoice on one card, a second claim for the same tool has nothing to match against. I'd be careful about calling that fraud detection. It's simpler: take software out of the expenses process, so the expenses process only has expenses in it. Our post on expense reimbursement fraud covers the controls for everything else.
Where this is going
I think the companies that get this right won't have a finance team that's better at the hunt to spot unusual spending changes. They'll have a system that spots them, and a finance team that decides what to do about the interesting ones. Not that long ago, plenty of finance teams typed bank statements into the accounts by hand. Then bank feeds arrived, and nobody went back. Spotting spend changes is at the same point now. Cledara customers save 23% on software spend on average and a typical customer gets 30+ hours a month back, and most of that comes from the six signals above being caught early and acted on.
If you'd like to see your own list with the alerts switched on, book a demo and we'll walk you through it. The free benchmarks at data.cledara.com are a good place to start on renewal prices in the meantime.
Cheers,
Brad