
Published March 2026 | Based on actual transaction and adoption data
This is the definitive ranking of SaaS tools, not by hype or analyst reports, but by what companies are actually buying. The data comes from real purchase transactions, real adoption rates, and real spending patterns.
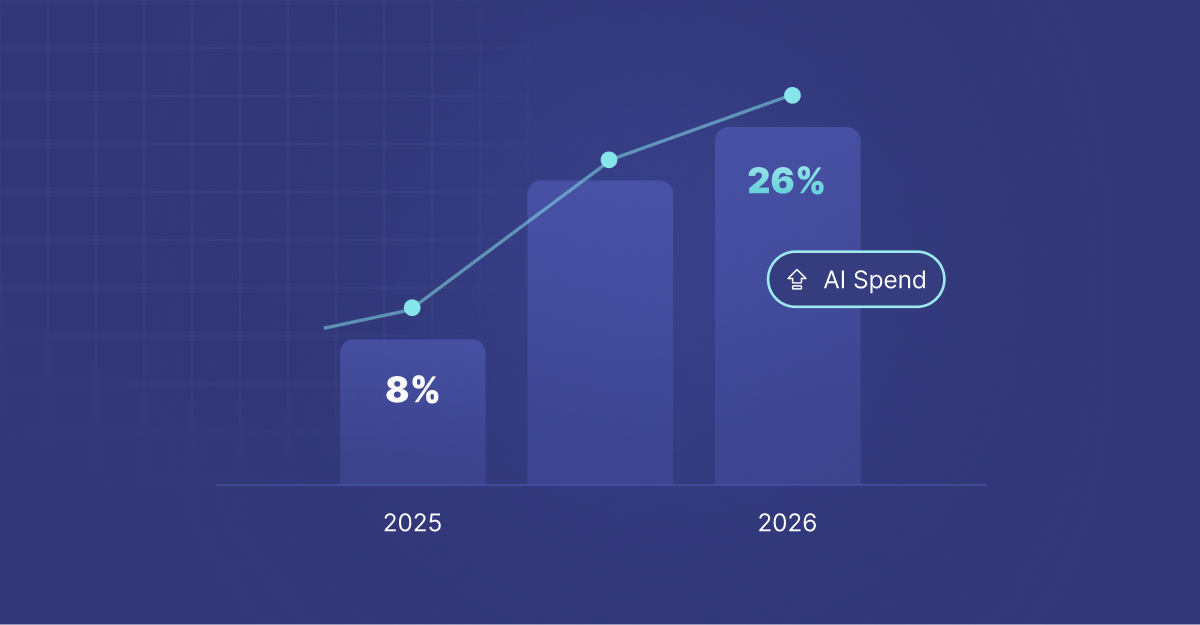
Two surprises stand out immediately. First, AI tools have crashed the top 10 with remarkable speed. Claude is at number eight. Cursor is at number nine. These tools didn't exist as market forces two years ago. Second, the traditional SaaS giants still own the market, but their margin of dominance is shrinking as specialized tools fragment adoption.
How to Read This List
Each tool is ranked by transaction volume. The adoption percentage shows what share of companies use it. The average spend per buyer shows the annual cost per organization. These three metrics tell a complete story about a tool's market position.
A tool with high adoption but low spend is either highly competitive or in early growth phase. High adoption and high spend means it's an entrenched platform. Low adoption but high spend means it's a specialized tool with real budget concentration.
The Core Layer: Platforms Owned by Three Companies
1. Microsoft - 57.5% adoption, $21,986 avg spend
2. OpenAI - 50.4% adoption, $7,718 avg spend
3. Google Workspace - 55.7% adoption, $21,929 avg spend
4. ChatGPT - 39.2% adoption, $5,938 avg spend
5. Atlassian - 49.0% adoption, $23,608 avg spend
6. GitHub - 56.5% adoption, $7,934 avg spend
7. Twilio - 26.3% adoption, $17,116 avg spend
8. Claude - 38.7% adoption, $3,182 avg spend
9. Cursor - 30.5% adoption, $5,857 avg spend
10. Xero - 28.6% adoption, $3,951 avg spend
The AI Cohort: Tools That Didn't Exist Five Years Ago
11. Adobe - 42.4% adoption, $6,377 avg spend
12. Cledara - 57.6% adoption, $5,970 avg spend
13. Figma - 59.0% adoption, $5,344 avg spend
14. Webflow - 23.8% adoption, $2,526 avg spend
15. Slack - 54.5% adoption, $7,555 avg spend
16. Zoom - 37.3% adoption, $8,391 avg spend
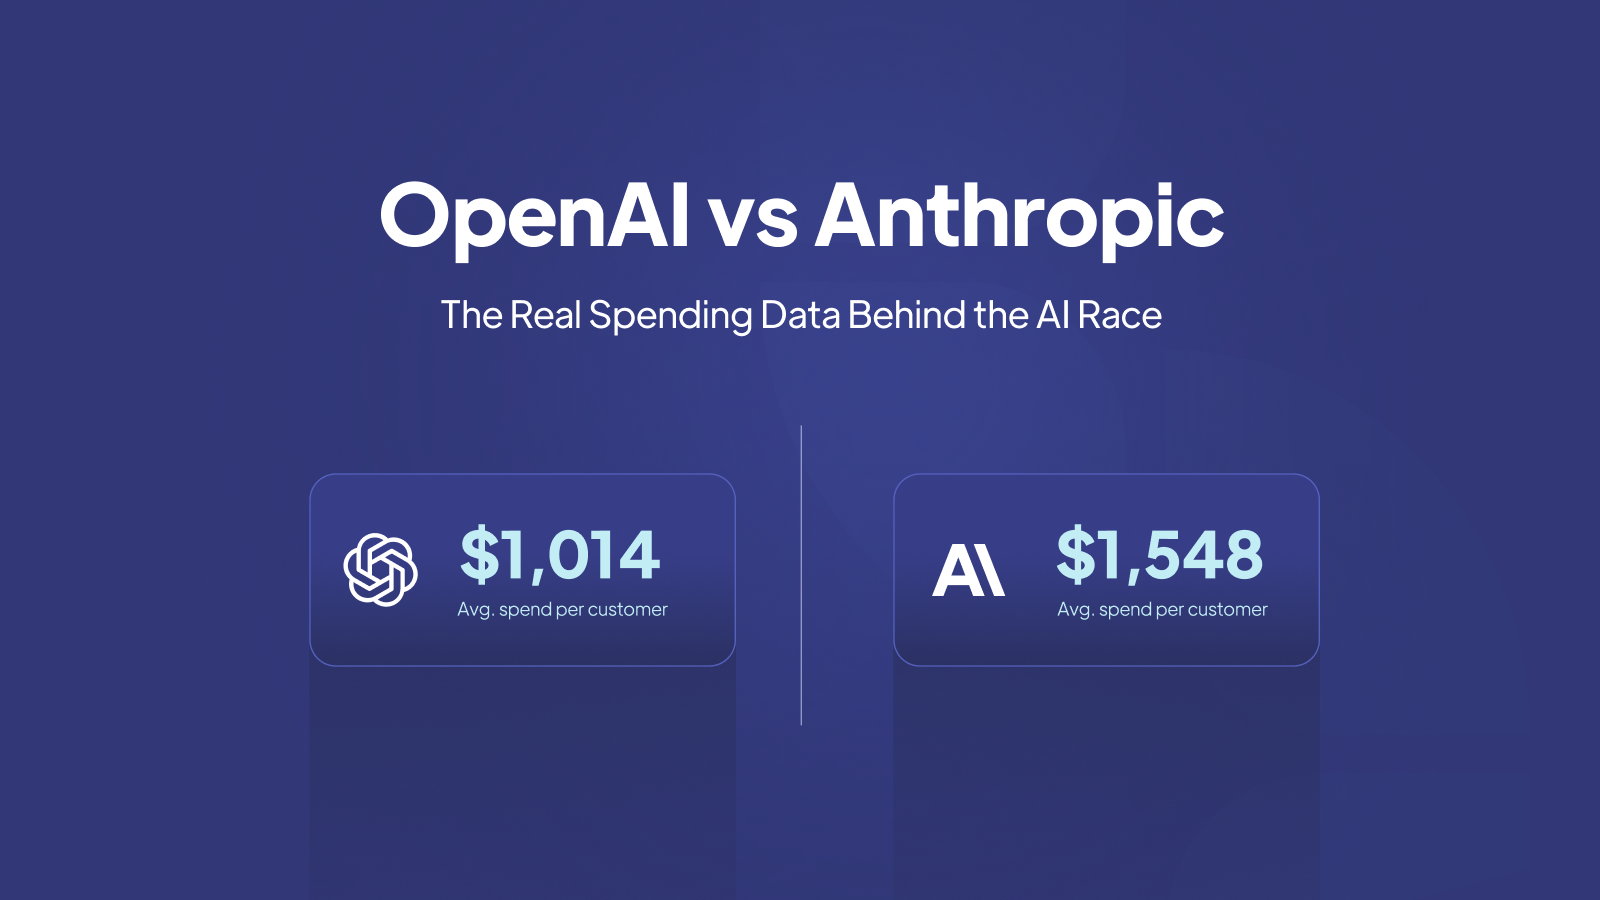
17. Anthropic - 16.5% adoption, $6,161 avg spend
18. Mailchimp - 21.0% adoption, $5,074 avg spend
19. HubSpot - 37.2% adoption, $30,903 avg spend
20. JetBrains - 33.3% adoption, $6,160 avg spend
The Specialized Performers: Niche Tools with Serious Budgets
21. Sentry - 32.2% adoption, $3,424 avg spend
22. CircleCI - 7.6% adoption, $5,390 avg spend
23. Adobe Creative Cloud - 20.1% adoption, $7,558 avg spend
24. Microsoft 365 - 10.3% adoption, $10,798 avg spend
25. Notion - 34.7% adoption, $7,511 avg spend
26. 1Password - 26.9% adoption, $4,955 avg spend
27. Zapier - 37.4% adoption, $3,331 avg spend
28. Miro - 33.4% adoption, $4,554 avg spend
29. LinkedIn Sales Nav - 16.9% adoption, $6,150 avg spend
30. Canva - 35.4% adoption, $523 avg spend
31. Typeform - 28.4% adoption, $1,350 avg spend
32. SendGrid - 14.8% adoption, $8,419 avg spend
33. Loom - 23.1% adoption, $1,496 avg spend
34. Calendly - 22.9% adoption, $2,361 avg spend
35. Vercel - 17.3% adoption, $3,853 avg spend
36. Intercom - 16.5% adoption, $17,398 avg spend
37. Zendesk - 13.8% adoption, $14,195 avg spend
38. SEMRush - 18.7% adoption, $4,775 avg spend
39. Mailgun - 11.5% adoption, $4,313 avg spend
40. BambooHR - 11.6% adoption, $17,631 avg spend
41. QuickBooks - 9.0% adoption, $3,825 avg spend
42. Make - 10.3% adoption, $1,149 avg spend
43. Datadog - 11.3% adoption, $30,809 avg spend
44. Auth0 - 8.1% adoption, $3,493 avg spend
45. Cookiebot - 10.8% adoption, $1,647 avg spend
46. Dropbox - 15.9% adoption, $2,854 avg spend
47. Ahrefs - 13.4% adoption, $5,897 avg spend
48. Midjourney - 14.1% adoption, $674 avg spend
49. Airtable - 10.9% adoption, $4,197 avg spend
50. Postman - 14.1% adoption, $5,041 avg spend
What the Rankings Actually Tell Us
The top 50 are dominated by a pattern: established platforms with high adoption and moderate-to-high spend. Microsoft, Google, Atlassian, Slack, and GitHub own the base layer.
But the surprise breakouts are revealing. Figma at number 13 with 59% adoption shows how fast design tools have consolidated. HubSpot and Datadog at 19 and 43 show that specialized enterprise tools command serious budgets, even at lower adoption rates. Claude, Cursor, and Anthropic in the top 20 prove that AI has already shifted from emerging to essential.
The tools with the highest average spend per buyer aren't the most adopted. HubSpot at $30,903 per buyer and Datadog at $30,809 show that certain tools scale with company size and complexity. These aren't tools companies dabble with. They're commitments.
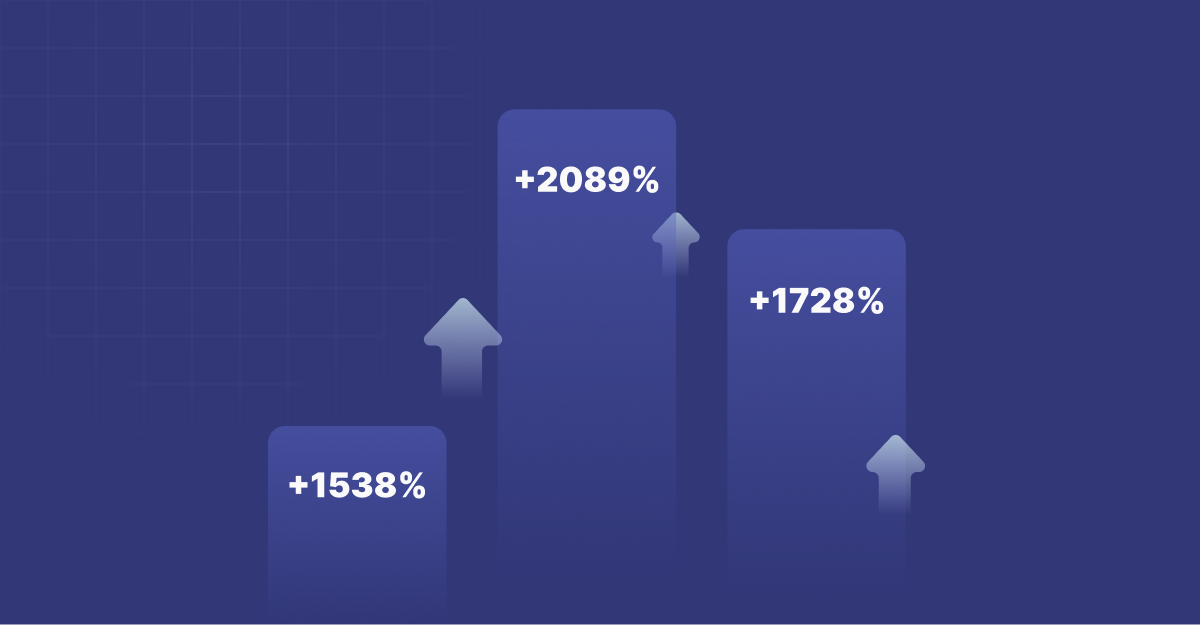
The emerging AI tools (Lovable, Firecrawl, OpenRouter) didn't make the top 50 by adoption percentage, but their growth rates (2,089%, 1,417%, 1,009% respectively) suggest they will within 12 months. The long tail is moving very fast.
A Question for Your Budget
If your company is using a significant portion of these 50 tools, you're not alone. But you're also probably not managing that complexity well. The median company runs 25 subscriptions. That's more than you'd expect, and probably includes significant waste.
The winners in 2026 won't be the companies using the most tools. They'll be the ones using the right tools, with the discipline to cut what doesn't work, and the flexibility to adopt new tools when they offer real value.
True ROI comes from visibility, not just knowing what you’re spending, but ensuring every subscription is actively driving growth. Cledara gives you the control to track, manage, and optimize your entire SaaS stack in one place, so you can stop overpaying and start scaling efficiently. Learn more at cledara.com.
This analysis is based on anonymized, aggregated transaction data from Cledara's platform. All figures represent averages, percentages, and ratios. No individual company data is disclosed. For detailed market analysis, visit data.cledara.com.