
Datadog vs New Relic vs Grafana: What Companies Actually Spend on Observability
When we analyzed spending patterns across 1.7 million SaaS purchases, one number stopped us in our tracks: companies using Datadog spend an average of $30,809 per year on that tool alone. That's not counting New Relic, Grafana, or the half-dozen other observability platforms in most engineering stacks.
Yet most engineering leaders don't know how their observability spend compares to industry benchmarks. They buy the tools their team demands, receive the invoices, and move on. This data gap costs organizations millions in duplicate tools and misaligned platform decisions.
We pulled real transaction data spanning 87 countries to understand what companies actually spend on observability tools in 2026. The findings challenge some common assumptions about monitoring, APM, and log management.
The Observability Category Has Become Non-Negotiable
Engineering and DevOps tools now account for 16 percent of total SaaS spending across companies, making it the second-largest functional category after sales and marketing tools. By adoption frequency, engineering actually edges ahead at 20 percent of all SaaS tool usage.
Within engineering spend, observability is one of the stickiest subcategories. Companies rarely cut monitoring and logging tools. When infrastructure goes dark, the cost of not knowing what's happening far exceeds the tool cost. This creates an unusual dynamic: observability tools command premium pricing power, and customers pay it.
The shift accelerated post-pandemic as companies built distributed systems, containerized workloads, and deployed to multiple cloud regions. Each new layer of complexity demanded deeper visibility. Observability transformed from a nice-to-have into a must-have utility.
Datadog's Market Dominance Reflects Its Pricing Power
Datadog has climbed from rank #44 in March 2024 to #26 in March 2026, a 18-position jump in just two years. This rapid ascent reveals two things: faster adoption and higher spend per customer.
The $30,809 annual spend figure reflects Datadog's premium positioning across three main product lines: infrastructure monitoring, application performance monitoring (APM), and log management. Most enterprise customers subscribe to multiple modules, and pricing compounds as data volume grows.
Datadog's infrastructure monitoring captures system-level visibility, dashboards, and alerting. The APM product traces individual application transactions across distributed systems. Log management ingests and indexes high-volume log streams. A mid-sized engineering team using all three layers typically spends $20,000 to $50,000 annually depending on infrastructure size and data retention policies.
The key insight from our data: Datadog's pricing scales with complexity. Teams managing container orchestration, microservices, and multi-cloud deployments face exponentially higher data volumes, which directly drives costs upward. This is intentional product design. Datadog makes money when customers grow and their systems generate more telemetry.
What Companies Actually Spend on Observability Alternatives
The comparison gets murky because observability platforms don't compete neatly. Datadog attacks the market from multiple angles simultaneously. New Relic focuses deeply on APM and application performance. Grafana positions as open-source friendly and cost-conscious. Sentry dominates error tracking and performance monitoring for development teams.
Comparing apples to apples is difficult. A company might use Datadog for infrastructure monitoring, New Relic for application APM, Grafana for visualization dashboards, and Sentry for error tracking. Their "observability spend" is fragmented across four vendors, totaling $40,000 to $80,000 annually depending on scale.
New Relic's pricing model traditionally tied to data ingestion, similar to Datadog. Companies report annual spend between $15,000 and $40,000 for mid-market deployments. The variability depends heavily on how much application telemetry gets sent through the platform.
Grafana operates differently. The hosted Grafana Cloud offering costs less than Datadog or New Relic, typically ranging from $5,000 to $20,000 annually. However, Grafana's strength lies in visualization and dashboard creation rather than serving as an end-to-end observability platform. Most Grafana customers also pay for one of the major APM tools.
Sentry focuses narrowly on error tracking, performance monitoring, and session replay for development teams. Annual spend typically ranges from $1,000 to $10,000, making it one of the most affordable observability tools in the stack. Many teams use Sentry as a complement to their primary observability platform, not a replacement.
The Open-Source Question: Why Grafana Grows While Prometheus Stays Niche
Grafana and Prometheus represent the open-source observability movement. Both tools are free to deploy and operate yourself. Yet our transaction data shows an interesting pattern: open-source alternatives are growing in adoption but remain marginal in total spend.
This gap exists because deployment complexity and operational burden shift the economics. Running Prometheus at scale requires dedicated infrastructure, expertise, and maintenance. A self-hosted Prometheus deployment for a 50-person engineering team might seem free, but the implicit cost of operation and on-call burden is substantial.
Grafana Cloud represents the happy middle ground: managed Grafana service with a moderate price tag. Companies avoid the deployment complexity of pure open-source while sidestepping the premium costs of Datadog. However, Grafana Cloud typically serves as a visualization and dashboard layer atop other data sources, not as a complete replacement for Datadog or New Relic.
Our data shows that open-source adoption accelerates in engineering-heavy organizations where teams have the expertise and time to operate these systems. But most mid-market and enterprise customers pay for managed solutions, even if they initially deployed Prometheus or Grafana internally.
The Sentry Layer: Error Tracking as a Distinct Budget Line
Sentry occupies a distinct position in the observability ecosystem. Rather than attempting to be a comprehensive monitoring platform, Sentry focuses on application errors, performance issues, and release tracking across web and mobile applications.
Many engineering teams subscribe to both Datadog and Sentry without overlap. Datadog handles system-level and infrastructure observability. Sentry handles application-layer errors and developer workflow integration. This layered approach lets engineering teams optimize spend by choosing the best tool for each job.
Sentry's pricing model makes this viable. A developer-focused team with moderate error volumes might subscribe to Sentry for $3,000 to $5,000 annually while simultaneously paying Datadog $25,000 for infrastructure and APM. The tools complement rather than compete.
How Observability Spend Scales With Company Size
The relationship between company size and observability spend is non-linear. A 10-person startup with a single production service might spend $5,000 annually on observability. A 50-person company with three independent services might spend $30,000. A 500-person organization with 30 microservices, multiple cloud regions, and distributed teams could easily spend $100,000 to $300,000 across all observability tools combined.
This escalation happens for structural reasons. Large organizations deploy across multiple availability zones and regions for redundancy. They run hundreds or thousands of containerized services. They generate terabytes of logs daily. Data volume drives cost exponentially, not linearly.
Additionally, large enterprises often negotiate custom pricing or bulk deals with vendors, partially offsetting increased data volumes. However, they also tend to standardize on a single primary platform (usually Datadog), reducing the fragmentation you see in mid-market organizations.
One unexpected finding: observability spend remains sticky even during periods of cost-cutting. When we analyzed budget adjustments during 2023 and 2024, engineering teams reduced spend on lower-priority tools but protected monitoring and observability budgets. This category operates more like a utility than a discretionary SaaS expense.
Why AI Tools Haven't Disrupted Observability Spend Yet
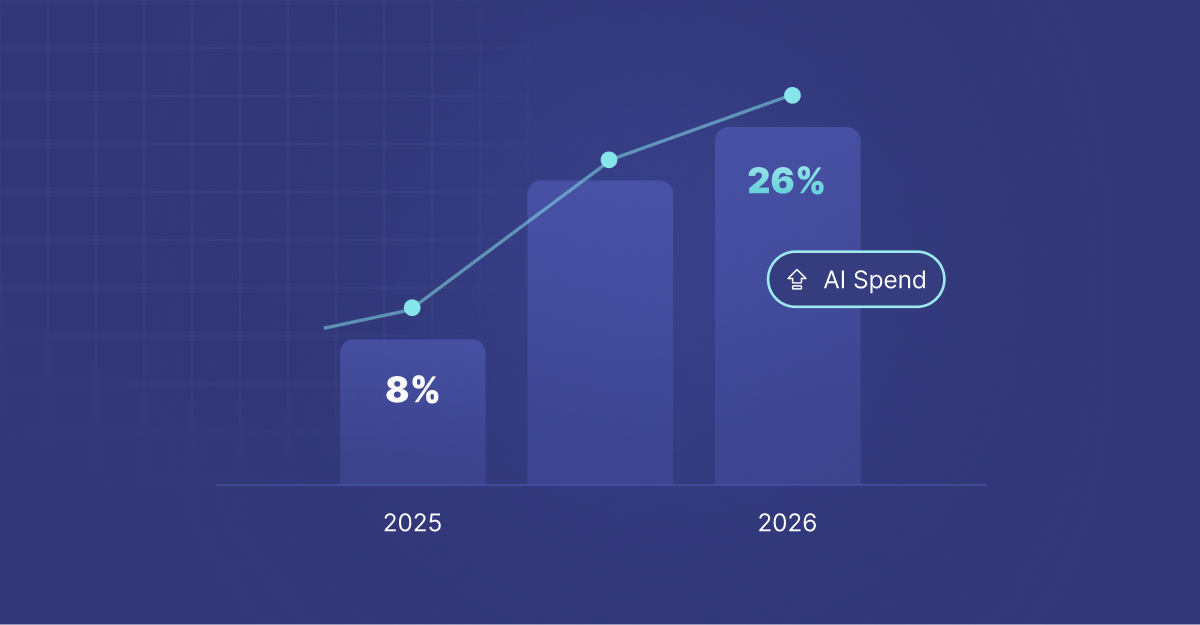
The rise of AI-powered DevOps tools hasn't materially reduced core observability spending, despite early predictions. New AI-native platforms promise to reduce monitoring complexity through intelligent anomaly detection and root cause analysis.
However, these tools layer on top of existing observability platforms rather than replace them. You still need Datadog or a comparable system to ingest metrics, logs, and traces. The AI tools consume that raw data and add analytical layers.
This creates an additive cost structure. Teams pay for foundational observability, then pay again for AI-powered analytics on top. A more mature engineering organization might spend $35,000 on Datadog and $8,000 to $15,000 on an AI monitoring platform, reaching nearly $50,000 in pure observability expense.
What This Means for Your Engineering Budget in 2026
If you manage engineering spend, the data points to a few actionable conclusions.
First, evaluate whether you're consolidating observability tools efficiently. Many organizations maintain overlapping tools due to historical decisions or team preferences rather than genuine technical requirements. A comprehensive audit of who uses what often reveals 20 to 40 percent savings opportunities through consolidation.
Second, understand that observability spend scales with complexity. If you're planning infrastructure changes, new service deployments, or cloud migrations, budget for corresponding observability cost increases. This isn't optional; the telemetry will happen regardless of whether you capture it intentionally.
Third, consider your organization's technical maturity. Small teams with simple architectures might optimize toward Grafana Cloud or Sentry to minimize cost. Large organizations with complex distributed systems should expect to invest significantly in Datadog or New Relic as non-negotiable infrastructure costs.
Finally, remember that observability tools are not equal. The cheapest option that meets your requirements isn't necessarily the best choice. A monitoring failure costs far more than the tool fee. The real question isn't whether you can afford Datadog, but whether you can afford not to have reliable observability when your production system fails.