The global SaaS market isn't actually global. It's three distinct markets that happen to share technology, languages, and business norms, but make wildly different purchasing decisions.
Companies in the US spend nearly twice as much per employee on SaaS as companies in Europe. UK companies adopt different tools than EEA companies. And the underlying business models that drive spending vary dramatically by region.
Understanding these differences isn't academic. It's essential for anyone building, selling, or managing SaaS at scale.
The Spending Gaps: More Than Just Currency
United States: 24.2% of total spend, approximately $349,000 average per buyer, 31 average subscriptions per company.
United Kingdom: 46.6% of total spend, approximately $209,000 average per buyer, 27 average subscriptions per company.
Europe (EEA): 29.2% of total spend, approximately $167,000 average per buyer, 24 average subscriptions per company.
The US spends 67% more per buyer than the UK, and more than 2x what the EEA spends. That's a massive gap. And it can't be explained by currency differences or exchange rates.
Several factors drive this. First, US companies are larger on average. More employees, larger operations, bigger budgets. Second, US salaries are higher, which means each employee needs more powerful (and expensive) tools to justify their cost. Third, the US has a higher tolerance for best-of-breed spending, where you pay more for a tool because it's the best at that specific thing.
The UK sits in the middle. It has significant financial and tech hubs in London and secondary cities. EEA countries tend toward more conservative spending, either due to economic constraints, different labor economics, or different purchasing decision processes.
Adoption Density: Fewer Tools, But Which Ones Matter
The subscription density tells a story about buying behavior. US companies run 31 subscriptions on average. UK companies run 27. EEA companies run 24.
That 7-subscription gap between US and EEA isn't random. It reflects fundamental differences in how teams buy software.
US buying committees tend toward "solutions" that are highly specialized. You need a tool for email, a tool for CRM, a tool for project management, a tool for design, a tool for analytics. Each one is best-in-class. Each one costs real money. The aggregated cost is high, but the value for that specialized use case is maximum.
European buying committees tend toward "platforms" that are reasonably good at many things. One platform for communication. One platform for project management. One suite for analytics. The per-tool cost is lower. The aggregated cost is lower. The specialization sacrifice is accepted as a trade-off.
This isn't a judgment. It's a business decision. US companies are willing to pay more to optimize for best-in-class tooling for each function. European companies optimize for lower total cost of ownership and operational simplicity.
Tool Preferences: The Regional Winner/Loser List
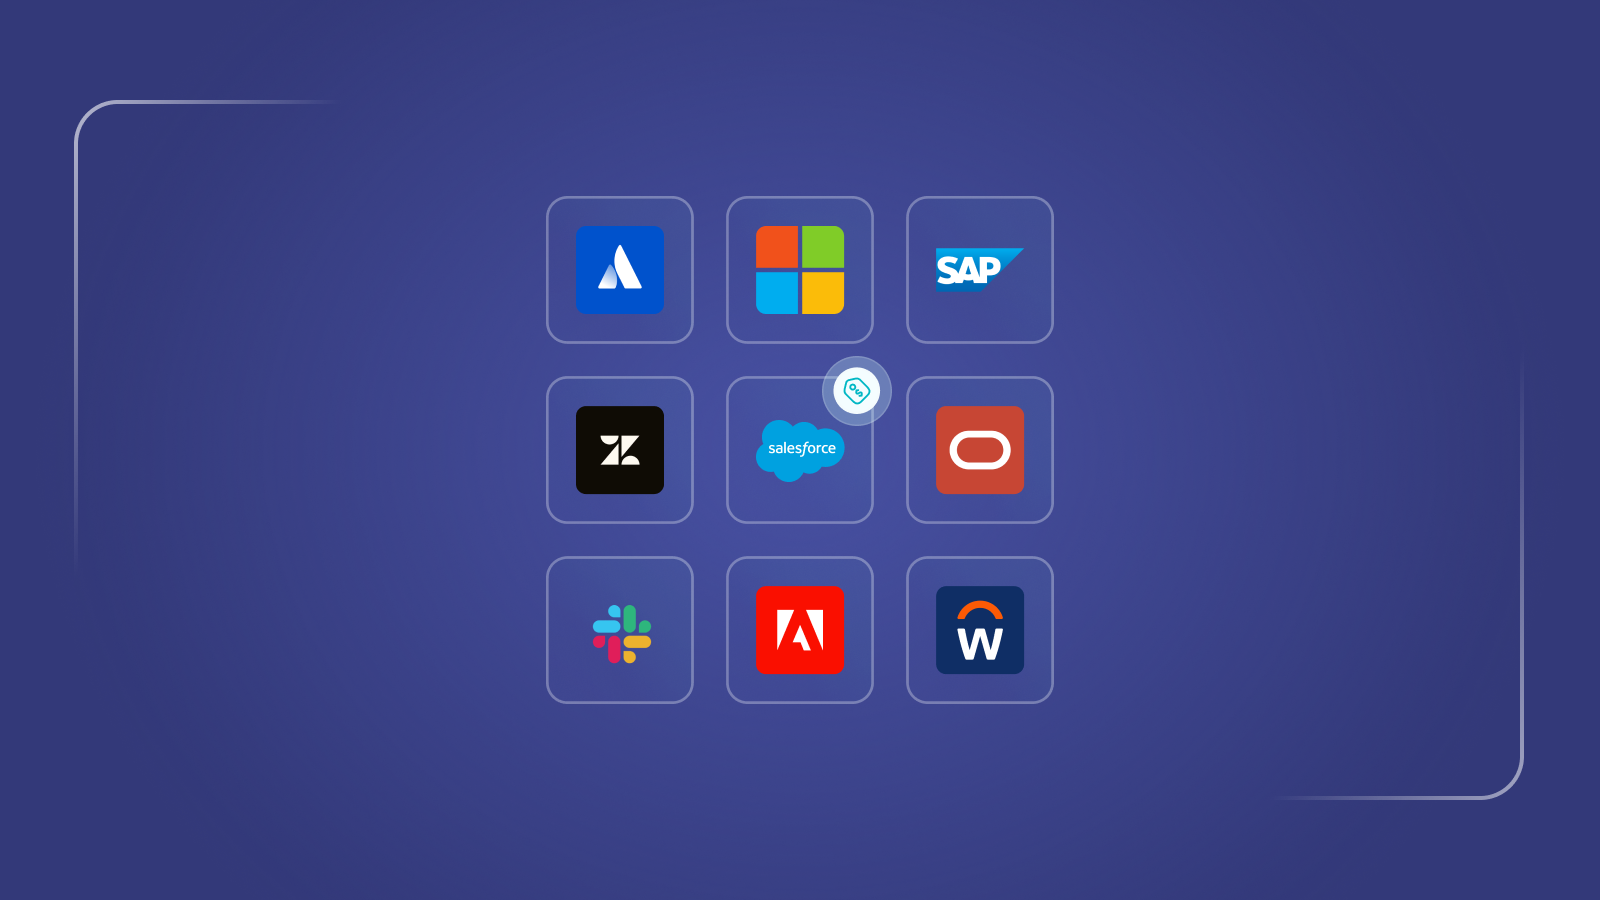
The most-adopted tools look similar across regions. Microsoft, Google Workspace, and Atlassian are top five everywhere. But there are clear regional preferences.
Top tools in the UK: Microsoft, Google Workspace, HubSpot, Atlassian, Twilio. Twilio's appearance in UK top five suggests strength in UK-based fintech, logistics, and SaaS companies that use Twilio for customer communications.
Top tools in the EEA: Google Workspace, Atlassian, HubSpot, Microsoft, OpenAI. OpenAI's stronger presence in EEA suggests higher adoption of AI tools for language generation and translation, possibly driven by the diversity of languages in European markets.
Top tools in the US: HubSpot, Atlassian, Google Workspace, Microsoft, GitHub. GitHub's stronger presence in the US reflects the dominance of US-based open source culture and the concentration of VC-backed startups in Silicon Valley that are heavy GitHub users.
These aren't huge differences, but they're meaningful. A vendor selling into the EEA needs to understand that OpenAI adoption is higher. A vendor selling into the US needs to know that GitHub saturation is extremely high and competition for developer tools is fierce.
The GDPR Effect: How Regulation Shapes Purchasing
The EEA spending pattern makes much more sense when you account for GDPR. Privacy regulation fundamentally changes SaaS buying.
Under GDPR, data residency matters. Data processing agreements matter. Compliance certifications matter. These requirements don't change the cost of a tool for the US, where CCPA compliance is minimal. But they do change the cost for EEA companies, where each SaaS tool requires lawyers to review, compliance teams to monitor, and sometimes architecture changes to ensure data stays in the right region.
That compliance cost is a hidden budget item. It's not in the SaaS subscription fee. It's in the legal and compliance overhead. So EEA companies are incentivized to use fewer tools, because each tool adds compliance burden.
The vendors that win in EEA are those with strong privacy certifications, EU data centers, and DPA processes that don't require consulting with lawyers for weeks. Microsoft and Google both have this. Smaller vendors often don't, which prices them out of serious EEA adoption.
The UK, post-Brexit, sits in an odd position. It's no longer bound by GDPR formally, but most UK companies follow GDPR-equivalent standards anyway, because their customers and partners are in the EEA. So UK spending patterns are influenced by GDPR without being legally required by it.
The Fintech and Startup Multiplier in the US
The US spends more per buyer partly because US companies are larger, and partly because the startup ecosystem is more concentrated in the US.
Startups spend more on SaaS than established companies. They have higher churn. They try more tools. They have smaller finance teams to say "no" to spending requests. They're trying to move fast, and that means buying best-in-class for each function.
The US has a much higher concentration of VC-backed startups than the UK or EEA. That startup density pulls up the average US spend significantly. A cohort of 100-person startups will spend 3x what a cohort of 100-person public companies spends on SaaS, because the startup environment incentivizes rapid tool adoption and experimentation.
The UK has a growing startup scene, particularly in London, which pulls UK averages higher than they'd be otherwise. But it's still smaller than the US ecosystem. The EEA's startup scene is fragmented across multiple countries and languages, which creates friction in tool selection and slows adoption overall.
The Price Sensitivity Gradient
Pricing strategy is different by region. Tools priced in USD don't necessarily win the US market by price. But tools that use regional pricing (lower prices for EEA) are more likely to gain adoption there.
This reflects real differences in purchasing power and price sensitivity. A tool that costs $500 per user per year might be considered expensive in EEA, but affordable in the US. The same tool with a 30% discount for EEA adoption could shift the buying decision entirely.
This is why you see some SaaS vendors with different tiers and pricing by region. Not because the product is different, but because the market's willingness to pay is different. Vendors that ignore this get lower adoption in price-sensitive markets.
The Future: Convergence or Continued Divergence?
Will regional differences shrink over time? Partially, yes. As more companies operate globally, they need the same tools everywhere. As GDPR matures, compliance becomes a solved problem rather than a blocker. As Europe's startup ecosystem grows, average spend will rise.
But structural differences will likely persist. The US will continue to spend more per buyer because the market, the capital availability, and the startup density are fundamentally larger. The EEA will continue to run fewer tools because regulation and consolidation pressures remain. The UK will continue to be the bridge, sharing characteristics with both.
For SaaS companies, the lesson is clear: regional strategy matters. You can't use the same go-to-market, pricing, and product roadmap globally. You need to understand what drives purchasing decisions in each region and adapt accordingly.
The global SaaS market is global in theory. In practice, it's three different games, with different rules and different winning strategies. Winners are those that understand the differences and execute regionally while maintaining global consistency.
This analysis is based on anonymized, aggregated transaction data from Cledara's platform. All figures represent averages, percentages, and ratios. No individual company data is disclosed. For detailed market analysis, visit data.cledara.com.