
Here's a question every CFO should ask their tech team: how many SaaS subscriptions do we actually have?
Most CFOs guess wrong. They think it's 10 or 15. The answer is usually closer to 25 or 30. And for some large companies, it's pushing 50, 75, even 100.
We analyzed the subscription count distribution across thousands of companies. The data reveals why SaaS management has become essential, and why even small companies are drowning in subscription overhead.
The Distribution: Most Companies Have More Than You Think
Let's start with the numbers. We looked at how many active SaaS subscriptions companies are maintaining. Here's what we found:
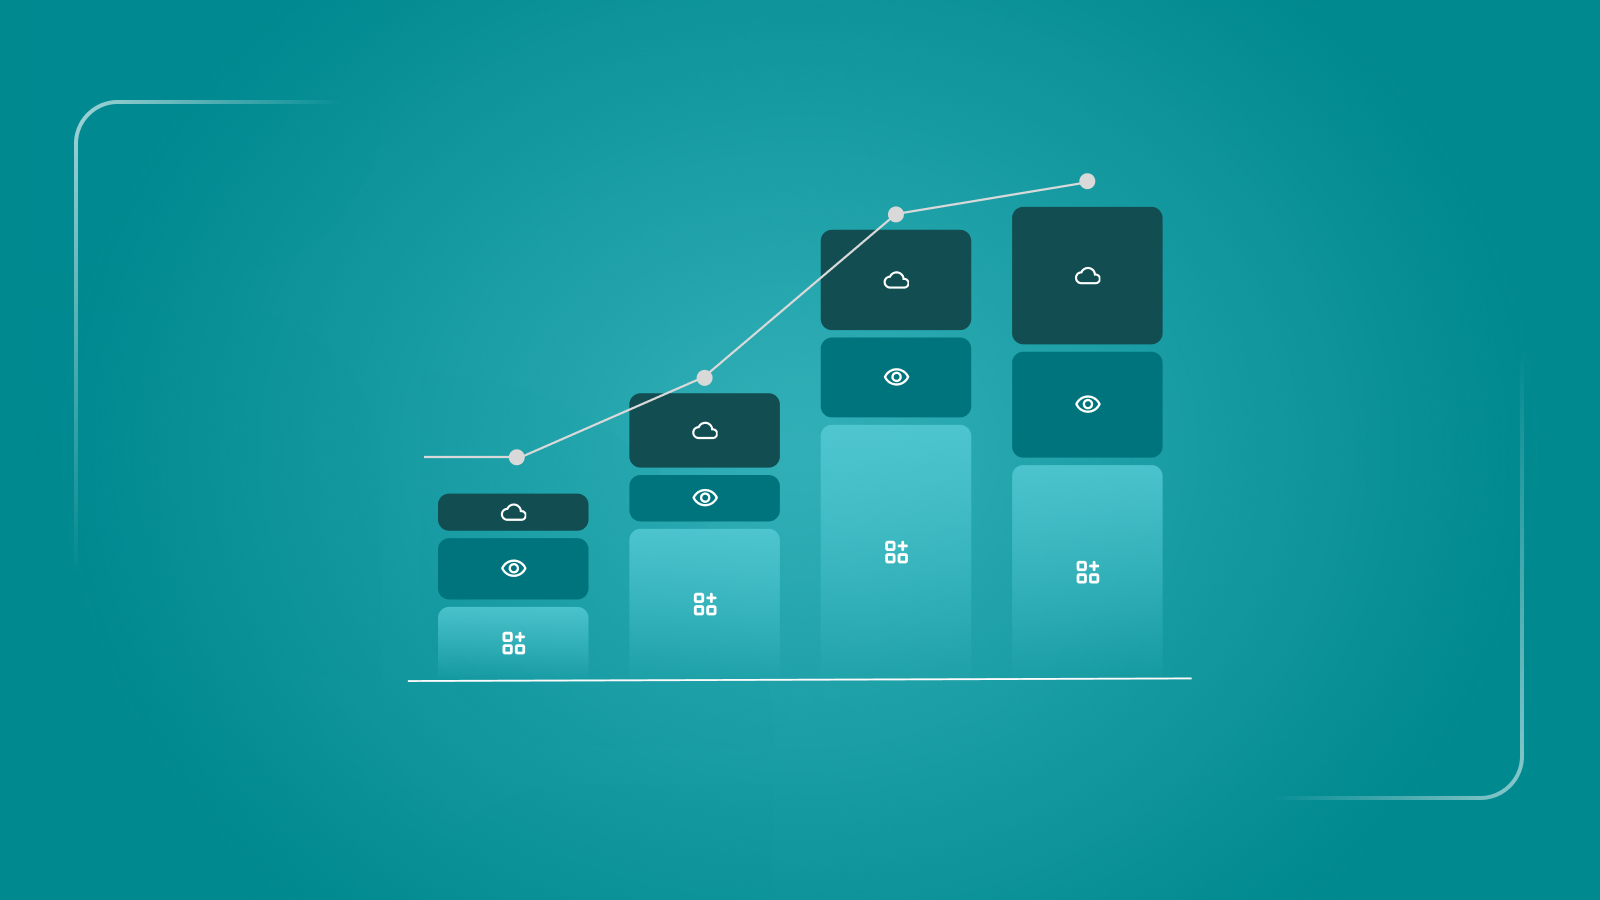
SaaS Subscription Distribution (2026)
1-10 subscriptions: 19.2% These are tiny operations: freelancers, very early-stage startups. Below this tier, you're basically running on founder tools and open-source.
11-25 subscriptions: 33.9% The largest segment. This is the typical post-seed startup or small business. You've got collaboration tools, productivity tools, development tools, and some specialized software.
26-50 subscriptions: 38.3% The largest segment by company count. Mid-market territory. You've got team-specific tools, department-specific tools, and enough legacy tools that you forgot about them.
51-100 subscriptions: 8.1% Large mid-market to early enterprise. Tool sprawl is now a documented business risk. SaaS management isn't optional, it's critical.
101-200 subscriptions: 0.5% Enterprise. These companies have full SaaS management teams and procurement processes. Probably still have shadow IT.
The median company has 25 active subscriptions. The mean is slightly higher at 26.4, suggesting that the long tail of large companies pulls the average up. But the middle 50% of companies are between 13 and 36 subscriptions.
Let that sink in. The typical company of any meaningful size is paying for 25 to 36 software tools every month, whether they're using all of them or not.
How SaaS Sprawl Happens
SaaS sprawl isn't a procurement failure. It's the natural result of how modern companies operate.
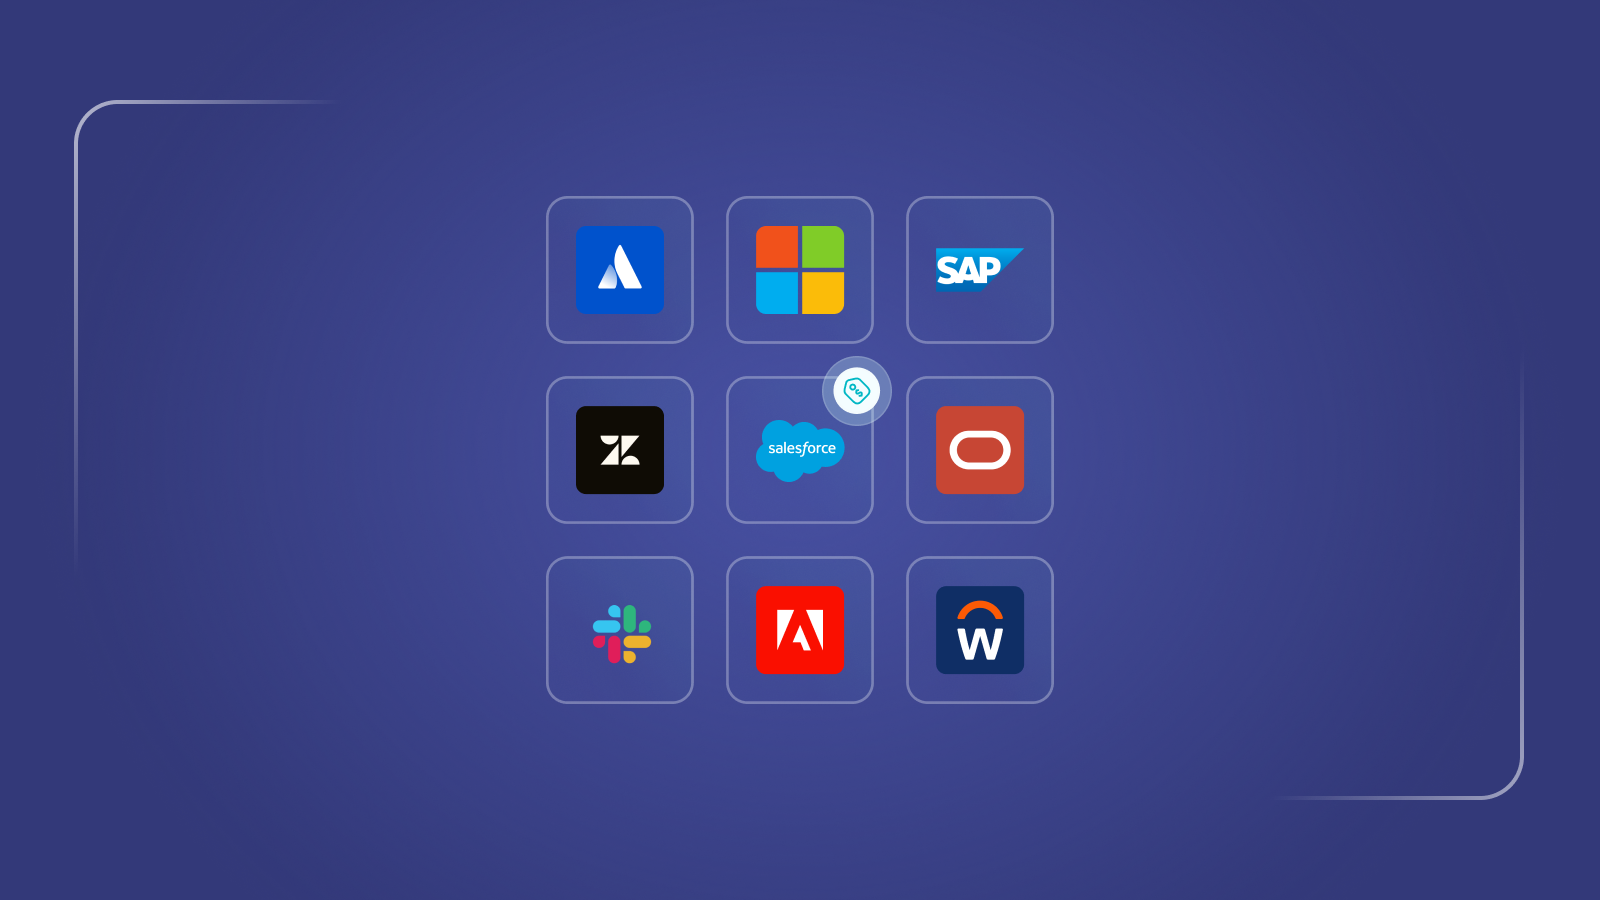
Marketing buys HubSpot. Sales buys Pipedrive because it integrates with their workflow. Product buys Jira. Engineering buys GitHub. HR buys a separate tool. Finance buys another. Each decision is rational in isolation but together, they create chaos.
Then add the experiments that never got turned off: a failed Slack bot that required three third-party integrations or a Zapier automation that someone built and forgot about.
Then add compliance and security tools: identity management, SSO, vulnerability scanning, backup. These are overhead costs that don't show up in individual team budgets.
Each decision individually makes sense. Collectively, they create a fragmented SaaS portfolio that costs money, creates security risk, and wastes employee time switching between contexts.
The Cost of Subscription Sprawl
Let's quantify this. Take a company with 30 subscriptions at an average of $300 per month each. That's $9,000 per month or $108,000 per year in subscription costs.
But the real cost is much higher. Here's why:
Unused licenses: Most companies are paying for seats or features they don't use. Industry estimates suggest 30-40% of subscriptions go substantially underutilized. For that $108,000, you're getting real value from maybe $65,000-$75,000 of it.
Overlap and redundancy: You're probably paying for multiple tools that do similar things. Chat tools (Slack, Teams, Discord). Productivity (Notion, Asana, Monday.com, Google Keep). File storage (Dropbox, Google Drive, OneDrive, Box). Each is $50-$200 per month. You're probably paying for 3 tools when you'd use 1.5 effectively. That's another $1,500-$2,500 wasted annually.
Integration overhead: Your IT team spends time setting up Zapier automations, maintaining custom integrations, onboarding employees into 10 different systems. That's either IT salaries burned or employee time in onboarding instead of productive work.
Security risk: 30 subscriptions means 30 accounts, 30 password managers, 30 potential breach vectors. If your SaaS sprawl extends beyond your IT team's visibility, you have shadow IT risk.
Renewal chaos: With 30 subscriptions, you have roughly 30 renewal dates throughout the year. If even one falls through the cracks and auto-renews at double the previous rate, you've lost $5,000-$10,000 in a single month with no approval.
The true cost of 30 subscriptions at $300 each isn't $108,000. It's more like $150,000 to $180,000 when you account for underutilization, redundancy, and operational overhead.
Why Consolidation Isn't the Answer
Some CFOs see this problem and think the solution is consolidation: pick three mega-vendors (Microsoft, Google, Atlassian) and tell everyone to use only those.
This doesn't work. When you enforce consolidation, you sacrifice team productivity for central control. The team that wanted Slack because it integrates with their workflow will use Microsoft Teams awkwardly. You save money but lose speed.
The companies we see managing SaaS effectively aren't consolidating everything to three vendors, they're managing a diverse portfolio strategically. They have a 25-35 subscription range, they track every renewal date, they audit quarterly for unused seats, and they have a clear decision-making process for new tools.
The key is not reducing the portfolio to zero. It's being intentional about what's in it and what's not.
What Good SaaS Management Actually Looks Like
Companies managing this well are doing four things:
1. Visibility: They know every active subscription, its renewal date, who is using it, and its cost. This sounds obvious. Many companies don't have this. IT knows what they provisioned. Finance knows what they're paying. But nobody has a single source of truth.
2. Governance: They have a process for new tool requests. It's not bureaucratic. It's just: "Before you buy something, check if we already have a tool that does this." This simple filter eliminates 20-30% of redundant purchases.
3. Usage monitoring: They audit seat usage quarterly and reclaim unused licenses. If you have 50 Slack users but only 30 are active, move off a plan. If you have 10 Adobe seats but only 6 are active, cut to 7. This alone recovers 5-10% of spending.
4. Renewal management: They track renewal dates and negotiate before the deadline. A $5,000/year tool that's been in place for two years probably has a 15-20% discount available if you ask. Applied across 30 tools, that's $10,000-$15,000 in savings.
These four things together typically reduce SaaS spend by 15-25% without sacrificing team productivity. A company with $150,000 in true SaaS costs could get down to $120,000-$130,000 by managing better.
Why SaaS Management Tools Matter
Here's the challenge: SaaS spending is growing because SaaS is genuinely useful. Companies aren't buying more tools despite the cost. They're buying more tools because they're valuable. The solution isn't to stop using new tools, it's to be deliberate about which tools stay and which ones go. Managing this yourself with spreadsheets works until you have 20+ subscriptions. After that, it breaks down. You need a SaaS Management tool that:
- Connects to your payment cards, banks, and email to discover subscriptions you forgot about.
- Aggregates renewal dates and creates alerts before they expire.
- Tracks seat usage and warns you when you're wasting money.
- Integrates with procurement to enforce governance.
While many tools claim to do this, Cledara is built specifically for this transition. By combining specialized virtual cards with management software, Cledara ensures that no tool is bought without a home, a purpose, and an owner.
Bottom Line
Whether you have 5 subscriptions or 49, you need SaaS management.
Start here: make a list of every SaaS subscription you're paying for right now. Include forgotten trial accounts, team-specific tools, and everything on your corporate card that IT doesn't track. You'll probably find 3-5 you forgot about. Those alone might be worth $1,000-$2,000 in annual savings.
A good spreadsheet works, but if you're looking for automation and peace of mind, Cledara is the best option for your team. You don't just get a list of what you're paying for; you get total control over how much is spent and who is spending it.
Learn more about Cledara and get started today.
This analysis is based on anonymized, aggregated transaction data from Cledara's platform. All figures represent averages, percentages, and ratios. No individual company data is disclosed.