Just under three quarters of the software market runs on American products, and that share is still climbing. Cledara data shows US SaaS market share reached 74.8% of all tracked spend in July 2026, up from 72.4% two years earlier. For all the discussion of digital sovereignty and European cloud independence, the American position has not slipped. It has quietly grown.
This matters for anyone signing software contracts. Concentration in one country means concentration in one currency, one regulatory regime, and one set of renewal cycles. Here is what Cledara's data on nearly 2,000 US-headquartered products shows about where the money actually goes.
Key Takeaways
- US-headquartered vendors held 74.8% of tracked SaaS market share in July 2026, up from 72.4% in August 2024.
- UK companies send 75.1% of their software spend to US vendors and just 6.9% to British ones.
- Companies in the EEA send 71.5% of software spend to US vendors. France, Germany and the Netherlands combined account for under 5%.
- Australia is a larger software exporter into Europe than any single European country, taking 7.6% of EEA software spend.
- Two products, Google Workspace and Microsoft 365, account for 13.2% of the entire tracked market between them.
- The average UK company runs 41 software tools, with a median of 37 and a 75th percentile of 60.
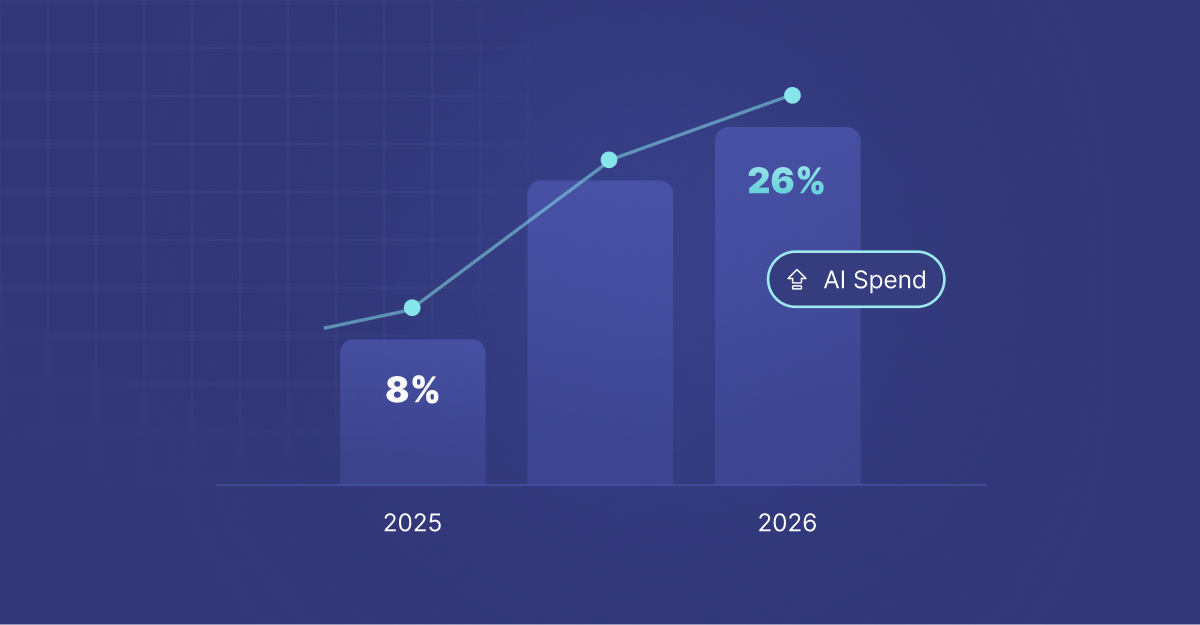
- AI tools grew from 7.1% to 17.0% of software spend in twelve months, and the leading AI vendors are almost entirely American.
How much of the SaaS market do US companies own?
US-headquartered products held 74.8% of tracked market share as of July 2026. Cledara tracks 9,257 SaaS tools across 32 countries, and close to 2,000 of the ranked products are headquartered in the United States.
The concentration inside that share is just as striking as the share itself. The top five American products alone account for 23.5% of the entire tracked market, while everything outside the top thirty, some 1,959 products, splits 29.6% between them. American software dominance is not a broad base of many mid-sized winners. It is a handful of very large platforms plus a very long tail.
You can explore the full ranked list on the most popular SaaS products from the United States page, which updates monthly.
Why is US SaaS market share growing rather than shrinking?
The trend line has moved in one direction over two years, though not in a straight line. US share sat at 72.4% in August 2024, first crossed 74% in May 2025, slipped back to 73.4% by October 2025, then climbed again to reach 74.8% in July 2026. The dips are shallow and short. The direction is consistent.
Two forces explain most of it. The first is that the fastest growing category in software, AI, is overwhelmingly American at the vendor layer. The second is that the products gaining share are platforms companies rarely replace: office suites, source control, CRM, and observability.
Sovereignty conversations tend to happen at the infrastructure layer, where alternatives genuinely exist and migration is a solved problem. The spend sits in the application layer, where switching costs are measured in retraining and lost institutional knowledge rather than migration hours. That mismatch is why policy intent and purchasing behaviour have diverged.
Where does UK and European software money actually go?
The gap between domestic and American software spend is much wider than most procurement teams assume.
UK companies send 75.1% of software spend to US-headquartered vendors and 6.9% to UK-headquartered vendors. That is close to eleven pounds leaving the country for every pound spent on British software.
Companies in the EEA send 71.5% to US vendors. French vendors take 2.0%, German vendors 1.7%, Dutch vendors 0.9%. The largest EEA-headquartered origins combined account for well under 10%.
US companies are the most domestically concentrated of all, at 81.6% to American vendors.
Worth noting that European buyers are not short of choice. UK companies in Cledara's data transact with more than 4,000 distinct software vendors, and EEA companies with close to 3,900. The concentration is not a function of a narrow market. Buyers have thousands of alternatives available and still route three quarters of spend to one country.
Why is Australia a bigger software exporter than Germany?
The most surprising number in the dataset has nothing to do with the United States. Australian-headquartered vendors take 7.6% of EEA software spend and 5.9% of UK software spend, putting Australia ahead of France, Germany, the Netherlands and every other individual European country as a software exporter into Europe.
The explanation is largely one company. Atlassian ranks first by software spend among EEA buyers in Cledara's data, ahead of Google Workspace, HubSpot, OpenAI and Microsoft. It sits second among US buyers and fourth in the UK. A single Sydney-headquartered vendor has achieved deeper penetration of European software budgets than the entire French or German software industries.
That is the useful counter-example to any argument that geographic proximity drives software buying. It does not. Category leadership does. Atlassian won developer tooling globally and the spend followed, 17,000 kilometres notwithstanding.
Which American SaaS products lead the rankings?
The top of the US table is dominated by tools most finance teams will recognise from their own card statements.
Google Workspace and Microsoft 365 together hold 13.2% of the entire tracked market. Two vendors, one category, and a share larger than most countries manage in total.
OpenAI is the outlier worth watching. It ranks fourth among US products by market share but first overall in Cledara's global popularity ranking, which means it has reached more companies than any other tool while still sitting mid-table on spend. That combination usually precedes a sharp climb.
Which SaaS categories are concentrated and which are fragmented?
Comparing product counts against market share exposes two very different category structures.
Collaboration and Productivity reaches 24.5% of tracked market share through 209 US-headquartered products. Marketing and Growth reaches 13.1% through 433 products, more than twice as many vendors. Marketing software has double the vendors and roughly half the share.
The practical read is that collaboration is a two-horse race where switching is painful and pricing power sits with the vendor. Marketing is a crowded field where alternatives are plentiful and negotiating leverage sits with the buyer. Engineering and DevOps sits between the two, with 359 products holding 8.8%.
If you are looking for savings, the fragmented categories are where the leverage is. The concentrated ones are where the risk is.
How many software tools does the average company run?
The average UK company in Cledara's data runs 41 software tools, with a median of 37. The spread is wide: companies at the 25th percentile run 17 tools, while those at the 75th percentile run 60.
Those tool counts are what make the concentration figures concrete. The 75.1% measures share of spend rather than share of vendors, so the two do not map one to one, and a handful of large American platforms will account for a disproportionate slice of that spend. Even allowing for that, a company running 37 tools is managing dozens of separate American vendor relationships.
That is the framing worth carrying into a board conversation about software risk. Not an abstract percentage of spend, but a count of individual vendor relationships, each with its own renewal date, price escalator and currency exposure, weighted heavily toward a single jurisdiction.
What is AI doing to American software dominance?
Reinforcing it, quickly. AI tools grew from 7.1% of software spend in August 2025 to 17.0% in July 2026, roughly a doubling inside twelve months.
The vendors capturing that growth are almost entirely American. Anthropic took the top spot on Cledara's monthly new-subscription leaderboard in both April and May 2026, with OpenAI, Google and Cursor filling out the positions behind it. Cursor is the clearest illustration of the pace: founded in 2022, it already sits seventh in Cledara's global popularity ranking.
Every percentage point that shifts from traditional software into AI tooling currently shifts toward US vendors. If AI keeps taking share from established categories, the American position strengthens by default rather than by competition. European AI vendors exist, but none currently leads Cledara's monthly adoption leaderboard.
What should finance teams do about US software concentration?
Concentration is not automatically a problem, but unmanaged concentration is. Three practical steps follow from this data.
- Measure currency exposure first. If three quarters of your software runs on USD-denominated contracts, your software budget carries FX risk whether or not anyone has modelled it. A 5% currency move on 75% of spend is a real variance against budget, and it arrives without a renewal conversation to warn you.
- Separate the concentrated from the fragmented. Renewal strategy should differ by category. Push hard in marketing and sales tooling where alternatives are genuine and switching is realistic. Focus on tier and seat optimisation in collaboration, where the achievable outcome is a better deal rather than a different vendor.
- Track AI as a category, not as individual tools. AI moved from 7% to 17% of software budgets in a year, usually through many small purchases rather than one large one. Teams monitoring only their largest contracts will miss it entirely until it appears in an annual review.
This is the visibility problem Cledara was built for: seeing every subscription, in every currency, across every team, before renewal dates arrive rather than after. When spend concentrates this heavily in one market, knowing exactly what you hold is the precondition for doing anything about it.
US SaaS market share heading into 2027
The American share of software has risen across the last two years of Cledara data, and AI is accelerating rather than disrupting that pattern. Nothing in the current trend suggests a reversal, and the Atlassian example shows that when a non-US vendor does break through, it happens through category leadership rather than regional preference.
The realistic question for European and UK finance teams is not whether to reduce American software exposure, which the data suggests almost nobody is actually doing. It is whether they have measured that exposure accurately enough to manage the currency, renewal and concentration risk that comes with it.
The rankings update monthly on Cledara's US SaaS market share page, drawn from real payment data rather than surveys or list prices.