
Monday.com vs Asana: The Project Management Spend Data (2026)
There's a telling shift happening in the project management software landscape. While both monday.com and Asana have dominated conversations about productivity tools for years, the latest spending data reveals a surprisingly different story about which platform is actually winning with buyers.
Monday.com is holding steady at rank #51 globally, while Asana has experienced a significant decline to rank #93. That's not a small gap. And the trajectory tells an even more important story.
The Rise and Plateau of Monday.com
Monday.com has established itself as a reliable player in the project management space. Currently ranked #51 in overall SaaS adoption, the platform has demonstrated remarkable stability over the past two years. Back in March 2024, it held rank #52, and even reached a peak of #28 in September 2025. This consistency suggests that monday.com has found a sustainable market position, even if it's not the dominant force some expected.
The platform's strength lies in its appeal to cross-functional and operations teams. Organizations managing complex workflows across departments have found monday.com's flexible, visual interface particularly valuable. The platform's ability to serve as a central hub for teams with diverse needs, rather than a specialized tool for one function, has proven to be a competitive advantage.
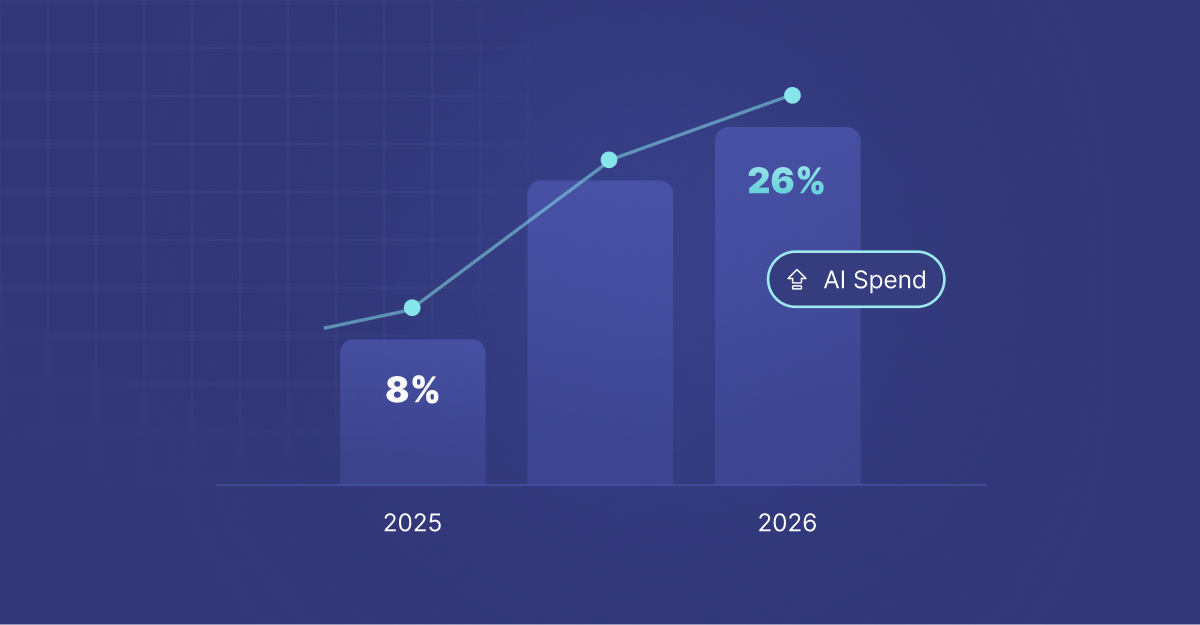
Within the broader Collaboration and Productivity category, which accounts for approximately 25 percent of overall SaaS popularity and 34 percent of total spending, monday.com occupies a solid position. This category represents a massive market, and monday.com's steady ranking suggests it's capturing consistent share.
Asana's Troubling Downward Slide
The data paints a more concerning picture for Asana. The platform now ranks #93, representing a significant drop from its previous position at #53 in March 2024. This isn't a minor fluctuation. Just two years ago, Asana was in the top 60 SaaS tools globally. The decline accelerated after reaching #45 in April 2024, suggesting that the competitive landscape shifted against Asana during a critical period.
For a platform that was once considered a category leader, this trajectory raises important questions. Asana hasn't disappeared, but its relative market position has weakened noticeably. The fact that the platform is still in the top 100 matters, but losing roughly 40 ranking positions in two years suggests that buyers are either switching to alternatives or choosing different tools for new projects.
This decline occurred despite significant product investment and marketing spend from the company. The falling rankings suggest that feature parity alone isn't enough to maintain market position. Something about how the market perceives and chooses between project management tools has changed.
What These Rankings Actually Mean
In Cledara's SaaS ranking system, positions reflect actual purchasing behavior across thousands of organizations in 87 countries. These rankings aren't based on marketing claims or user counts. They're built on real transactions, representing how organizations actually spend money on software.
When a platform drops from #53 to #93, it means fewer new organizations are purchasing that tool, fewer existing customers are renewing at the same levels, or some combination of both. It's not opinion, it's purchasing reality.
The divergence between monday.com and Asana is particularly interesting because both operate in the same category. They compete for the same customers. Yet one has stabilized while the other continues to lose ground. This tells us that market preference isn't random. Something specific is driving these divergent outcomes.
Who Chooses Monday.com, and Who Chooses Asana
The key difference lies in the use case. Monday.com appeals primarily to operations, marketing, and cross-functional teams managing varied project types. The platform's strength is flexibility and visual workflow management. It works whether you're managing a marketing campaign, a product launch, or operational processes.
Asana, historically, positioned itself more heavily toward product teams and project portfolios. The platform was designed for organizations with complex dependency management and large-scale project coordination. This positioning worked well in earlier years, but the market has shifted.
Specialized tools have emerged and taken share in specific verticals. Linear has captured engineering teams seeking a developer-centric alternative. Jira, part of the Atlassian platform ranked at #6 globally, dominates for software development teams. Teams primarily using Asana for engineering work have largely moved to these alternatives.
The key transition point appears to be around late 2023 and early 2024. That's when the decline in Asana's rankings began accelerating. This timing coincides with market consolidation around specialized tools and a broader shift toward integration rather than single platforms.
Pricing and Competitive Positioning
Asana's pricing has historically been premium compared to alternatives. For organizations managing budgets closely, especially in an economic environment where SaaS spend scrutiny is high, monday.com offers more flexibility at lower costs. This has become increasingly important in 2025 and 2026 as companies make harder choices about their software stacks.
Monday.com's model allows teams to self-select the features they need rather than paying for a full feature set. This flexibility appeals to cost-conscious organizations, particularly those managing mixed use cases across departments.
The Implications for Buyers
If you're currently evaluating project management tools, the rankings suggest some important considerations:
For operations and cross-functional teams: Monday.com's consistent ranking and stability suggest it's a safe, proven choice. The platform's flexibility means you can adapt it to multiple use cases within your organization.
For specialized use cases: The best tool may not be a general project manager at all. Engineering teams should seriously evaluate Linear. Product teams might consider Jira or specialized product management tools. Marketing teams have other options like Airtable or even Monday.com for specific workflows.
For cost-sensitive organizations: The spending data suggests that monday.com delivers more perceived value per dollar than Asana, at least from the perspective of purchasing organizations.
If you already use Asana and it works well for your team, there's no urgent need to switch. Tools that work for specific teams often matter more than general rankings. But if you're contemplating renewal or thinking about consolidation, the trajectory suggests exploring alternatives makes sense.
Looking Ahead: Will Asana Recover?
Asana has the resources and product quality to compete, but the market has shifted in ways that make generic project management less valuable than it once was. Recovery would require either significant repositioning toward a specific use case or a dramatic improvement in the product's perceived value.
The company has made significant product investments, but the rankings suggest these haven't yet translated back into market gains. This is a pattern sometimes seen in platforms that were leaders but missed key market shifts.
Monday.com's stability suggests a different approach: rather than trying to be everything, the platform has found sustainable market position by being genuinely useful for operations and cross-functional teams. That's not the top of the market, but it's a defensible position.
The lesson here is that in the SaaS market, positioning and focus often matter more than features or resources. Asana's decline and Monday.com's stability tell that story clearly.